Virtana Platform
The Virtana Platform is a unified AIOps and hybrid IT observability solution that delivers comprehensive visibility across on-premises, colocation, and public cloud environments. By collecting high-fidelity operational data and applying advanced AI capabilities, including root cause analysis, anomaly detection, predictive analytics, and self-healing, Virtana collects and transforms complex application, infrastructure, and AI data into actionable insights that help organizations optimize performance, improve reliability, and proactively address issues.
The Virtana Platform includes the following core modules:
Global View: Global View is the centralized intelligence layer of the Virtana Platform, bringing together data from Virtana and third-party sources into a single unified view. It intelligently deduplicates, enriches, correlates, and remediates alerts while providing a consolidated inventory and topology of resources across the organization. By leveraging AI-driven analytics, Global View automatically identifies root causes, tracks capacity utilization and costs for hybrid applications, and enables users to query infrastructure data using natural language.
Container Observability (CO): Deep visibility into applications running in Kubernetes-based environments.
Infrastructure Observability (IO): Monitoring for physical, virtual, and cloud-based infrastructure.
Service Observability: Full-stack monitoring for IT services, with dynamic service modeling.
Cloud Cost Management (CCM): Visibility and control over cloud spending, with rightsizing recommendations.
For detailed descriptions of each module, see What is the Virtana Platform.
Deployment architecture
The Virtana Platform can be used in three different ways:
Hosted by Virtana as a SaaS service
Hosted ON-prem as a VM
Hosted ON-prem as a Kubernetes cluster
Hosted by Virtana (SaaS) architecture
In the SaaS deployment model, Virtana hosts and manages the entire platform control plane, storage backends, and analytics engine in a secure, multi-tenant cloud infrastructure. Customers only need to deploy lightweight data collectors within their target environments.
Virtana cloud control plane
Virtana provides a fully managed, centralized platform that delivers unified intelligence and analytics across your environment, including Global View, event correlation, AI-driven anomaly detection, root cause analysis, and reporting capabilities. It ensures secure identity and multi-tenancy management through centralized identity providers, role-based access control (RBAC), Single Sign-On (SSO), and strict tenant data isolation. In addition, Virtana handles all operational maintenance, including platform upgrades, security patching, high availability, disaster recovery, and database management, enabling organizations to focus on operations and insights without infrastructure management overhead.
Data collection and ingestion
Data Collection and Ingestion in the Virtana Platform is powered by lightweight, customer-deployed components that securely collect and transmit telemetry to the Virtana SaaS platform. Container Observability (CO-South) runs as an agent within customer-managed Kubernetes environments, including on-premises deployments and cloud platforms such as AWS EKS, Google GKE, and Azure AKS, streaming observability data over secure TLS/HTTPS connections. IO collectors are deployed as lightweight virtual appliances within customer data centers or private cloud environments to gather metrics from compute, storage, virtualization, and SAN infrastructure. All collectors use outbound-only HTTPS communication over port 443, eliminating the need for inbound firewall exceptions and ensuring secure, seamless data transfer to Virtana.
Hosted On-Premises as a Virtual Machine (OVA)
The VM-based deployment model provides a self-contained, turnkey virtual appliance packaged as an Open Virtualization Appliance (OVA) for VMware vSphere/ESXi and other enterprise hypervisors. This model is ideal for organizations requiring on-premises data residency, strict regulatory compliance, or air-gapped environments without the operational complexity of managing a standalone Kubernetes cluster.
Pre-configured virtual Appliance
The Pre-configured virtual appliance provides a fully integrated and pre-configured deployment option for Global View, combining a lightweight embedded container engine, such as K3s, with all required platform dependencies, including PostgreSQL, Solr, time-series storage, Kafka, and Keycloak. It comes with the Global View control plane, user interface, and core analytics services pre-packaged and ready to run within a single virtual machine, simplifying deployment, reducing operational complexity, and accelerating time to value.
Lifecycle and maintenance
The Lifecycle and Maintenance capabilities of the Virtana Platform simplify ongoing platform operations through automated upgrade mechanisms that support both connected environments, where container images and Helm charts can be fetched directly, and air-gapped environments, where updates can be applied using downloadable offline artifact bundles. The appliance also includes built-in administration tools, automated certificate management, and pre-configured storage volumes, reducing operational overhead and enabling streamlined deployment, maintenance, and system management.
Data center integration
Connects directly to local IO collectors and containerized workload clusters running CO-South agents over the local area network.
Kubernetes-based architecture
The Virtana Platform uses a Kubernetes-based architecture that supports centralized management, distributed data collection, and unified observability across hybrid and multi-cloud environments. The architecture is organized into distinct layers that together provide authentication, monitoring, analytics, and automation. A central management cluster acts as the control plane, workload clusters run your applications, and IO extends monitoring into your data centers.
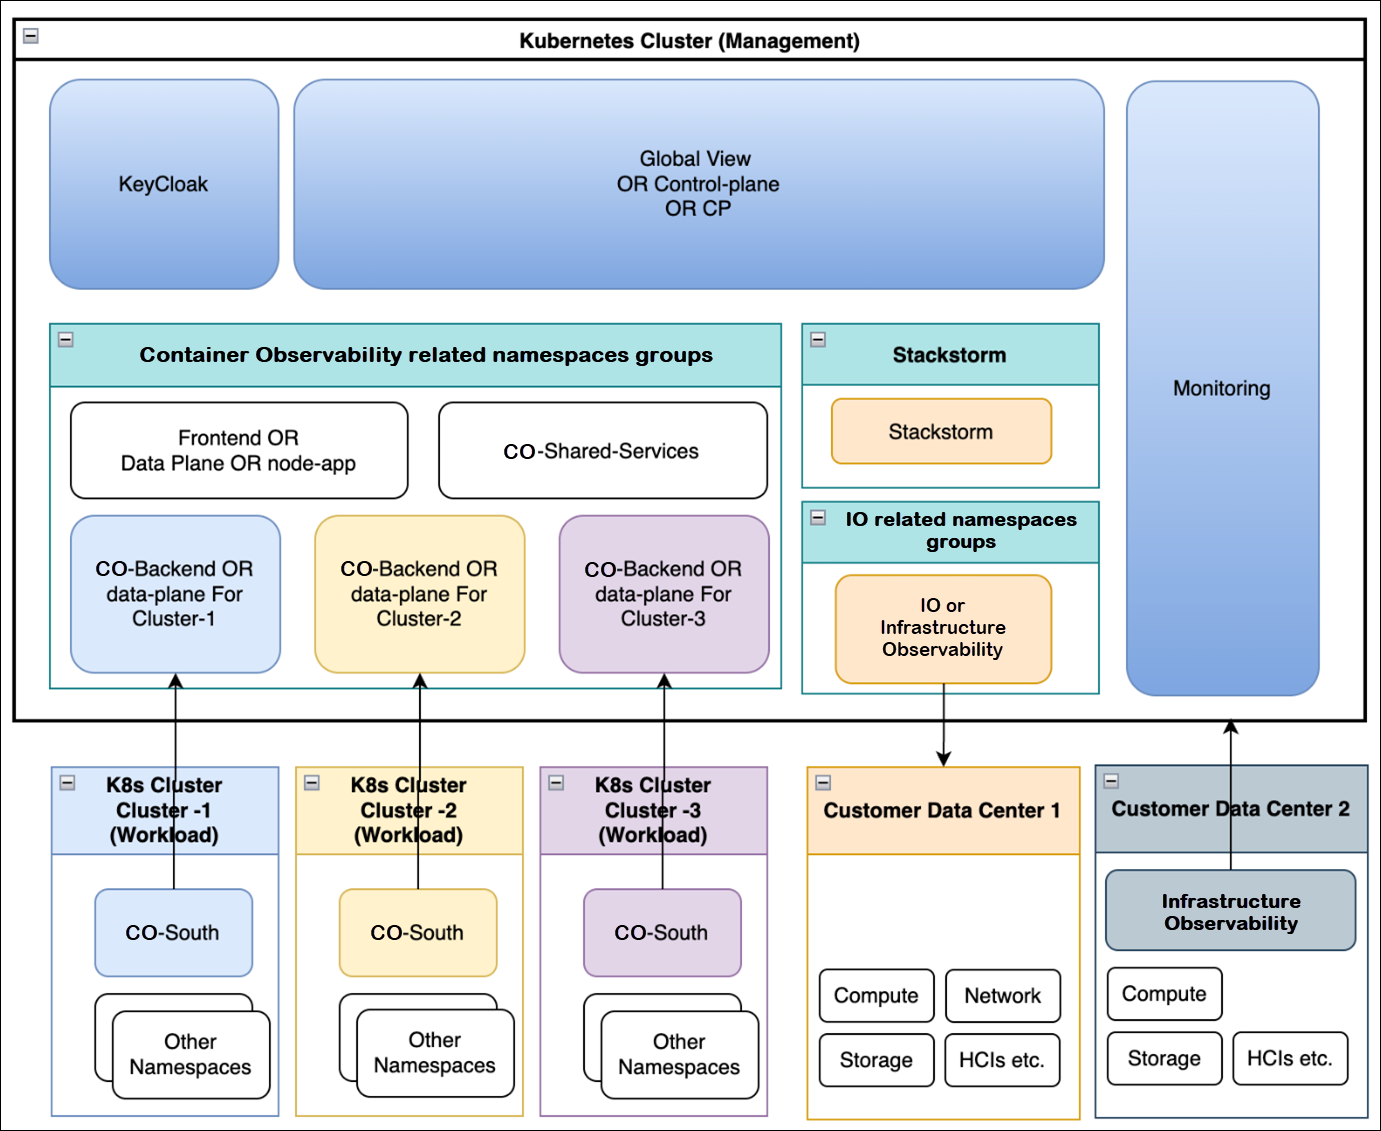
Kubernetes-based deployment architecture. The management cluster contains Keycloak, the Global View control plane, CO namespace groups, a StackStorm namespace, an Infrastructure Observability namespace, and a monitoring layer. Below it, three Kubernetes workload clusters each run a CO-South component, and two customer data centers are monitored by IO.
Management cluster
The management Kubernetes cluster acts as the control plane for the entire solution. It hosts the Global View service, also called the control plane (CP), which provides the event intelligence AI platform and orchestration functions. Within the management cluster, the platform is segmented into namespaces for core capabilities.
The management cluster includes the following namespaces and services:
CO namespaces contain the UI and data-plane components, shared services, and a set of CO backends that scale horizontally, one backend for each connected workload cluster.
The IO namespace ingests, processes, and analyzes infrastructure telemetry.
The
StackStormnamespace provides the automation and workflow engine that drives actions across the environment.Keycloak provides authentication for the platform.
The monitoring layer tracks the health of the platform itself.
Workload clusters
Beneath the management plane, multiple Kubernetes workload clusters run your applications. Each workload cluster includes a CO-South component that sits close to the workloads. CO-South collects cluster-level and application-level telemetry and sends it back to the CO services in the management cluster. Otherwise, these workload clusters are standard Kubernetes environments with their own customer namespaces and services.
Customer data centers
The platform also extends into customer data centers, where IO collectors and services monitor traditional infrastructure, including compute, storage, networking, and Hyperconverged Infrastructure (HCI) platforms. Telemetry from these on-premises environments flows into the Infrastructure Observability layer in the management cluster. Together, the CO and IO layers give the Virtana Platform a unified view across both containerized workloads and conventional infrastructure, all coordinated through a single centralized control plane.
Global View Multi‑Tenancy architecture
Global View supports multi-tenant deployments, so a single platform can serve multiple organizations while keeping each tenant's data separate. This design suits enterprises and managed service providers that manage several customers, departments, or business units on the same platform.
Global View multi-tenancy support includes:
Multiple tenants (organizations) per deployment.
An
ORG_ID(a UUID) for each tenant.Per-tenant endpoints for Container Observability (CO) and Infrastructure Observability (IO).
The following diagram shows how Global View keeps each tenant's data separate, even though all tenants share the same platform.
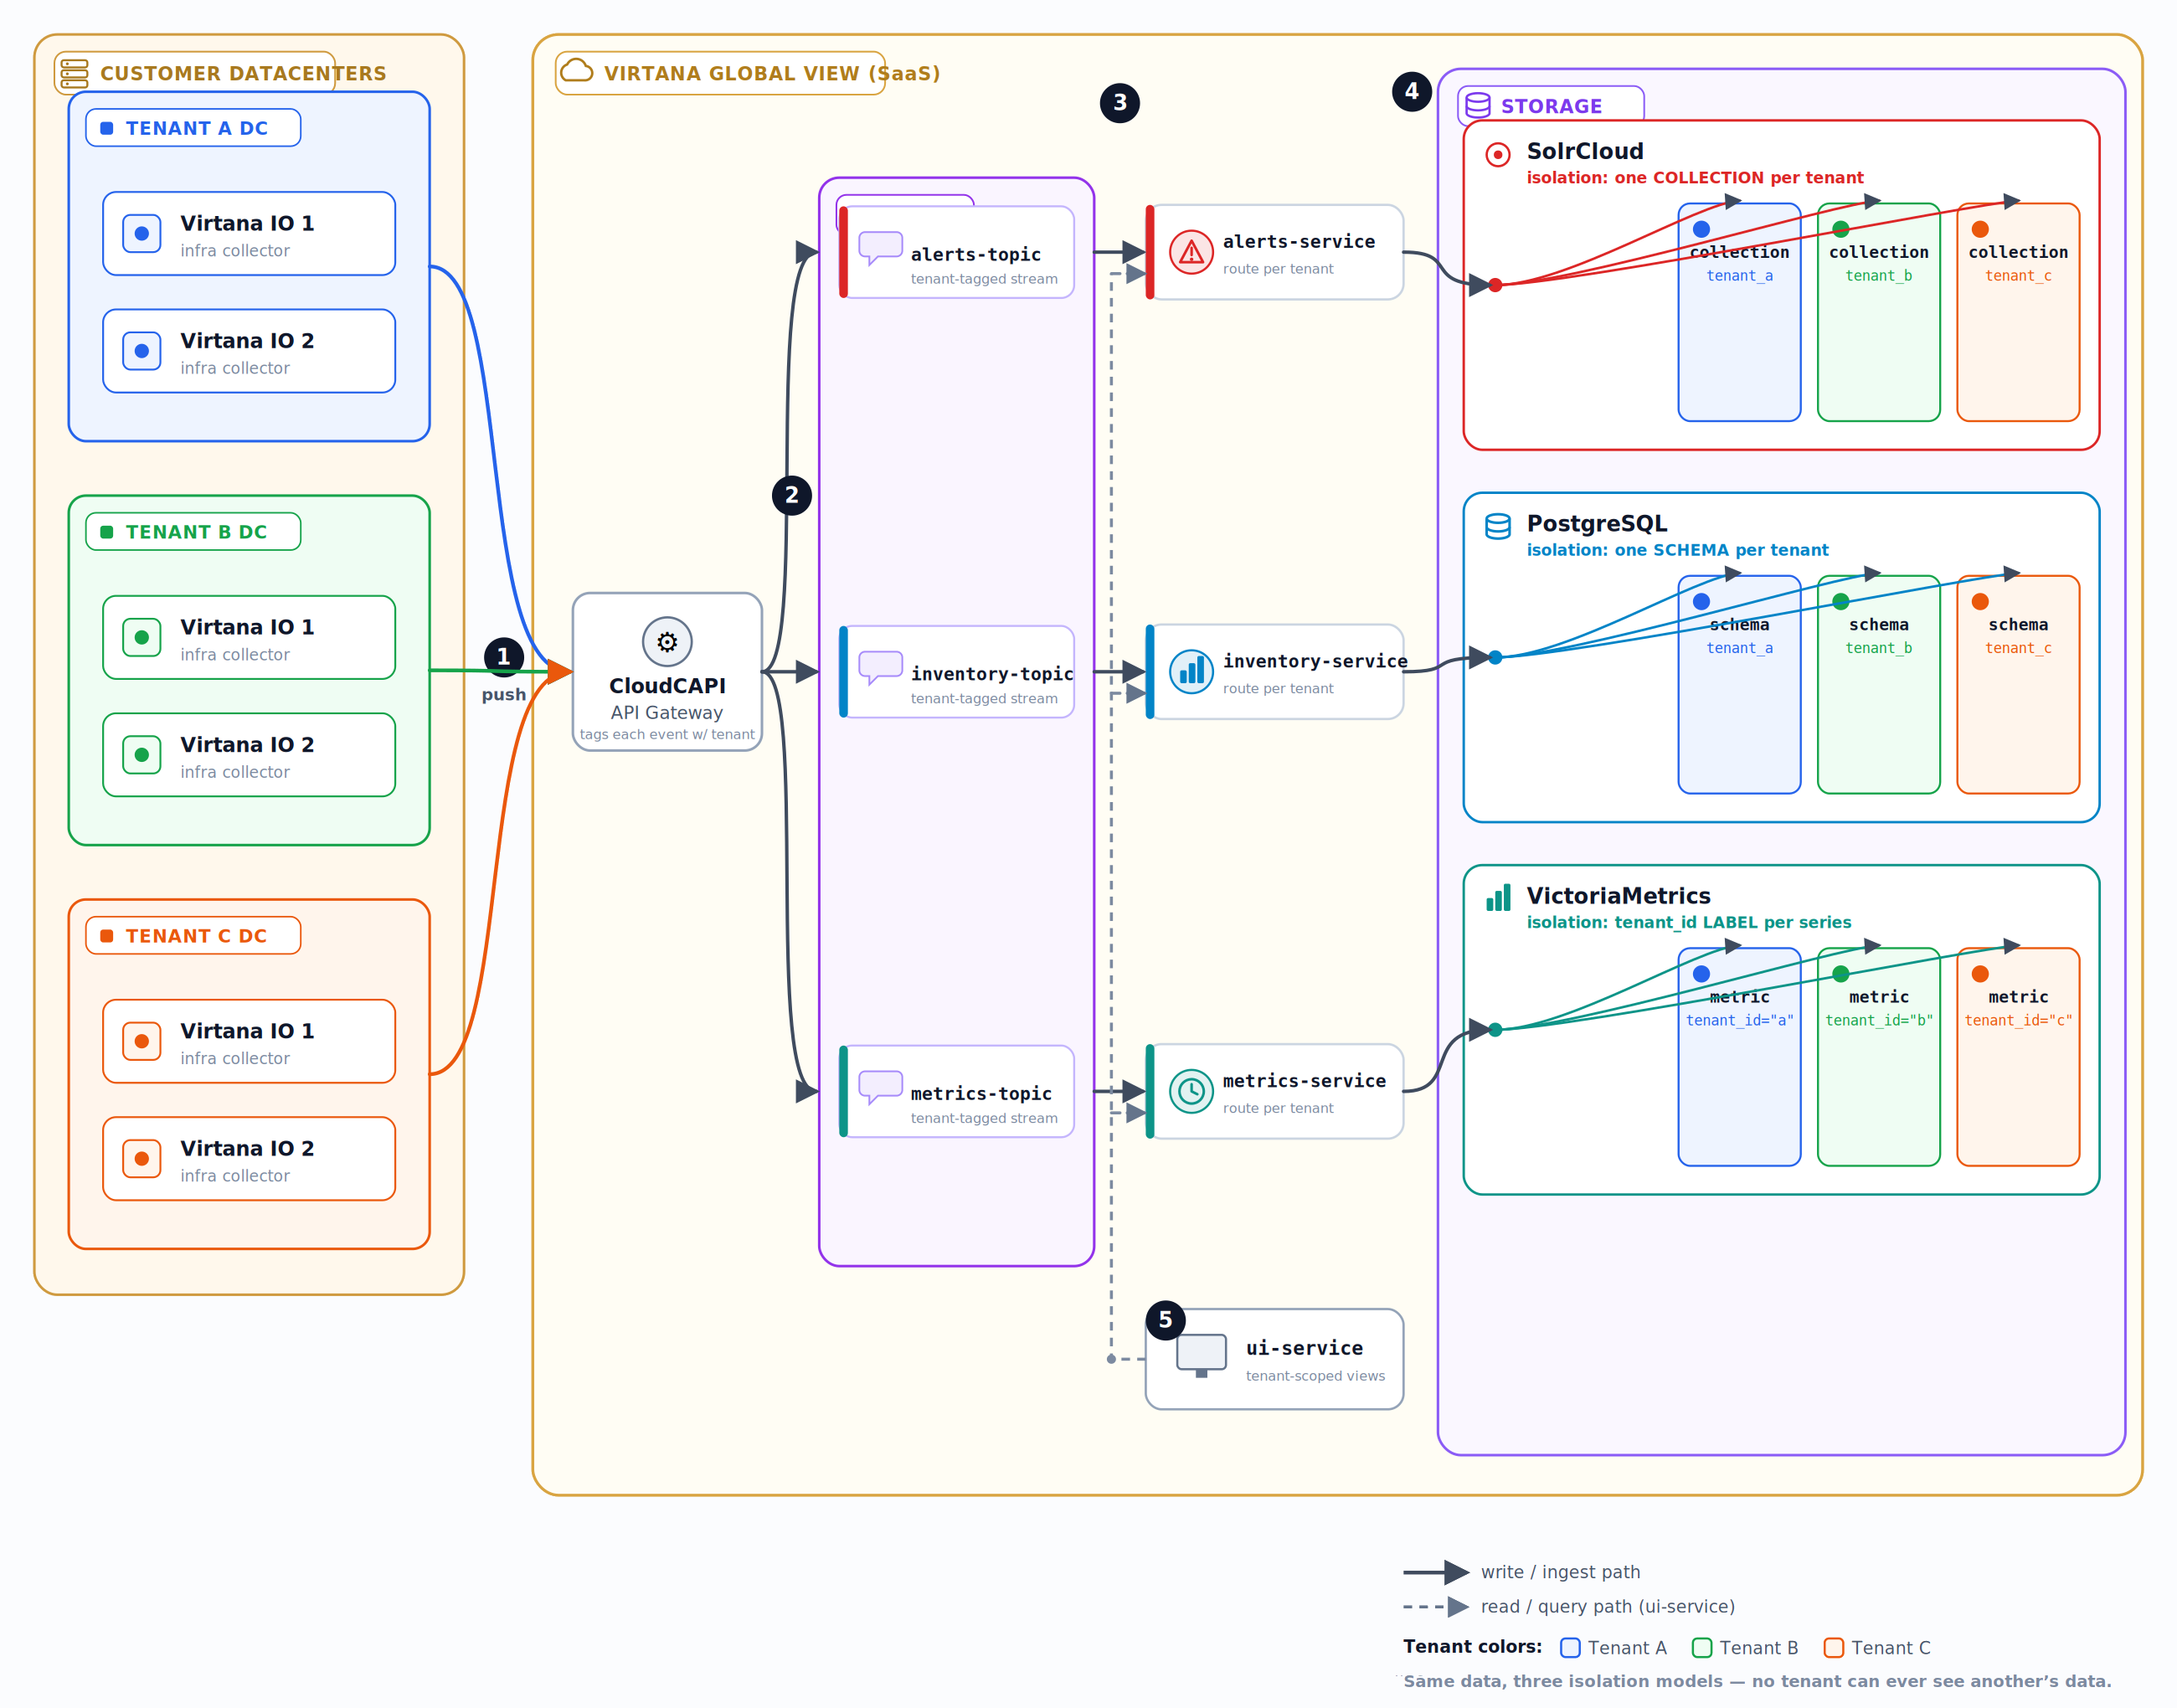
Multi-tenant data segregation diagram. Infrastructure Observability collectors from three tenant data centers push events to the CloudCAPI API gateway, which tags each event by tenant and routes it to tenant-tagged Kafka topics and services. Data is stored per tenant in SolrCloud (a collection per tenant), PostgreSQL (a schema per tenant), and VictoriaMetrics (a tenant_id label per series), and the UI service reads back only the requesting tenant's data.
Data isolation is maintained on a per-tenant basis, ensuring that each tenant can access only its own data.