Service Observability
Virtana Service Observability (formerly Zenoss Cloud) is a leading software-as-a-service, deep infrastructure monitoring platform. Service Observability builds real-time models of IT infrastructure and services and uses machine learning algorithms to quickly identify the root causes of outages.
To learn more, see our Virtana Service Observability documentation.
You can also explore our technical documentation for Virtana Service Dynamics (formerly Zenoss Service Dynamics) and our Virtana ZenPack Catalog (formerly Zenoss ZenPack Catalog).
Key features
Virtana Service Observability offers a wide variety of tools to help you get started with IT monitoring:
Dashboards. Virtana Service Observability dashboards display key indicators of a collection of entities over any range of time. You define the collection of entities a dashboard includes—its scope—with a query. Indicators include metric graphs, status tables, lists, maps, notes, and more.
To get started quickly, you can copy an existing dashboard or copy one of our templates.
Anomaly detection service. The anomaly detection service uses an advanced neural network algorithm to pinpoint metric data points that deviate from the normal range of values. This service ensures accurate, precise, and near real-time results through the use of deep historical data and frequent model training. Results are visible across various platforms, including Smart View pages, dashboards, and the action service.
Smart View. Smart View pages display an entity's metric graphs and event charts for the selected time range. Unlike user-created dashboards, Virtana provides Smart View pages for every entity. They include dependency information—either in a ranked list or an interactive graph—for the anchor entity. AI assistants highlight critical graphs and anomalous data. This combination of relevant information makes Smart View pages the premier tool for investigating infrastructure and service issues.
Actions. The action service provides tools for responding automatically to changes in your environment. You set up the service to monitor incoming events or metric data points and, when specific criteria are met, it sends one-way notification messages.
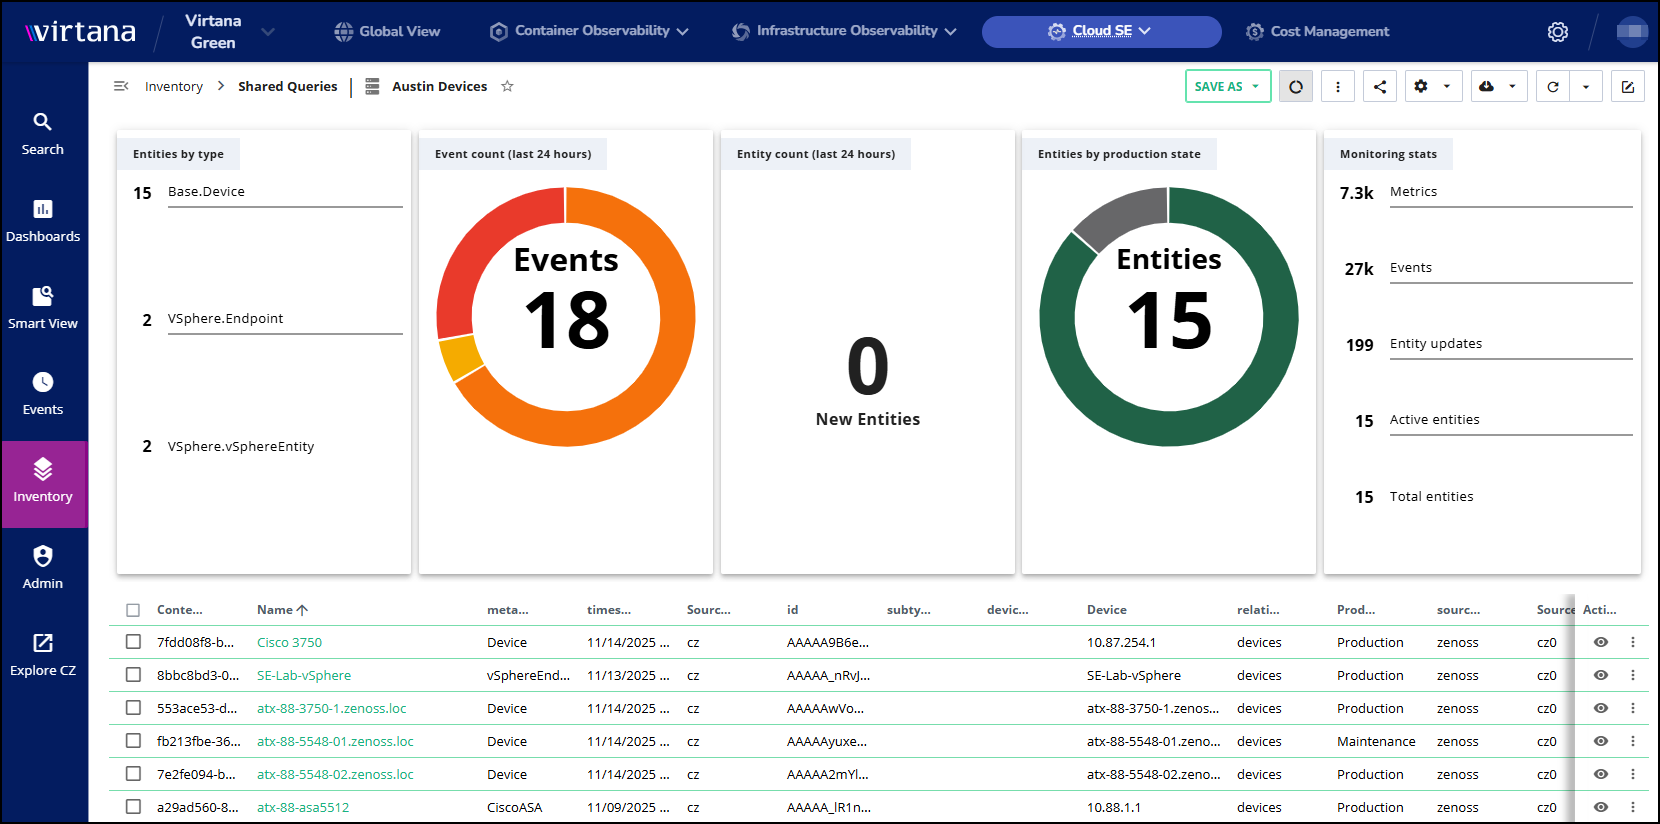
Inventory. The Inventory view provides a comprehensive, easy-to-navigate table view of entities and their properties within your Service Observability environment. Because entity properties vary significantly across different data sources, the default display for a multi-source entity table often includes a large number of columns. To simplify the process and allow you to focus on specific entities, you have the option to build, save, and share custom queries for filtering the tables.
Events console. An events console displays an interactive table of all events in the current time range and tools for managing events. You can see related metric graphs and compare related events side-by-side.
Dictionary. Virtana Service Observability's dictionary entries improve the usability of metric and event data displays by providing readable or compact alternatives and supplemental details for computer-generated field names.
Streaming data. Virtana Service Observability gathers model, metric, and event data through various streaming data methods, all using the Virtana's API's data receiver. These updates can be single transactions or continuous data flows.
Data collection methods include ZenPacks, connectors (for public cloud applications), agents (Docker images or native packages, direct or proxied), and integrations (custom apps through data receiver resources or Virtana libraries).
All streaming data flows can be customized using the policy service to define, manage, and enforce access control policies.
Virtana Collection Zones (CZ). A Collection Zone represents a set of collectors, which are groups of services that gather availability, performance, or model data from infrastructure resources and services. Collectors can be used for logical or geographical separation of resources and services within an organization, and with this flexibility, one Collection Zone is typically all that is needed.
Credentials. The credentials service provides secure, centralized storage for the credentials that are required to integrate with external services. Enter the credentials once and reuse them as often as you wish when you configure connectors or destinations.
API, Data Access, and ZenPacks. Virtana Service Observability offers several customization and integration options:
The Virtana Service Observability API is the preferred interface for direct access to Virtana Service Observability services.
The optional Data Access feature enables using SQL tools to analyze monitoring data.
Customized ZenPacks can be added to Collection Zones for new functionality, ranging from simple additions like new device classes to complex extensions of the data model and creation of new collection services.
Logging in to Service Observability
To log in to Virtana Service Observability, you need a supported browser, a login account, and the correct URL.
Log in to Virtana account using your assigned credentials.
In the Virtana menu bar, click Service Observability and select your instance.
The default Service Observability homepage opens.