Service Performance
You can view the list of Pod or node services and the number of incoming and outgoing traffic connections to the services for the selected timeframe.
To view traffic flow, follow the steps:
Log in to the Container Observability Application.
On the sidebar menu, click Reports and select Performance under service.
On the top bar, you can choose an entity with a namespace.
A list of services is displayed.
The service page represents the following details:
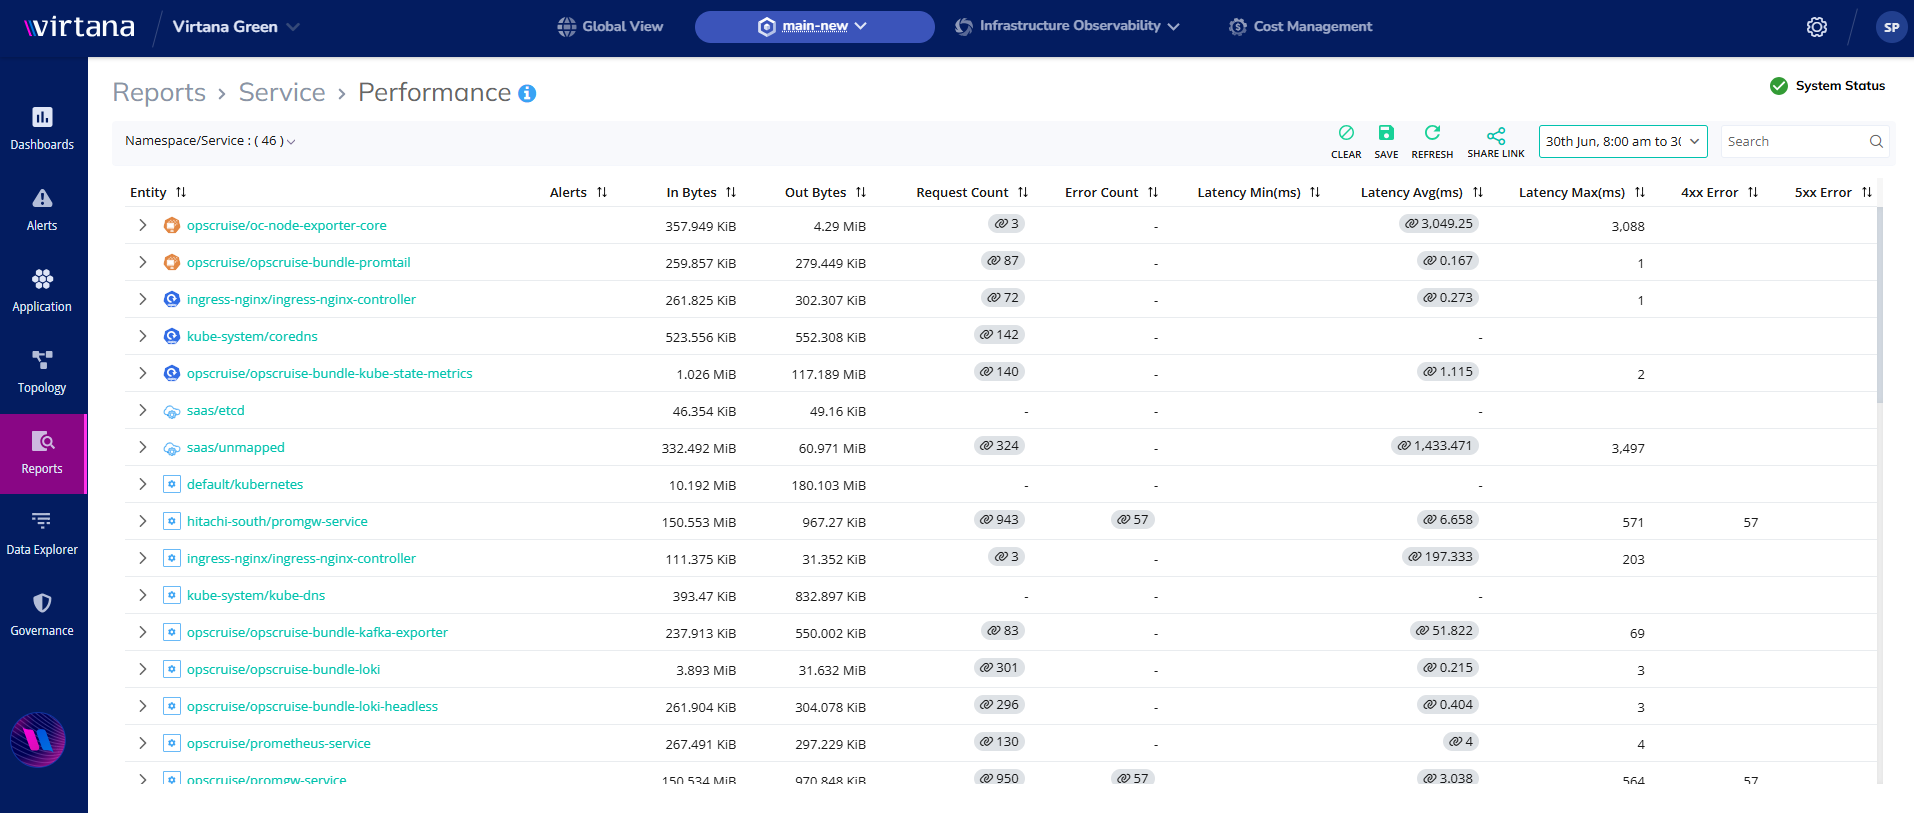
Network flow in L4 and L7 layer metrics.
L4: Service Metrics
L7: URL metrics
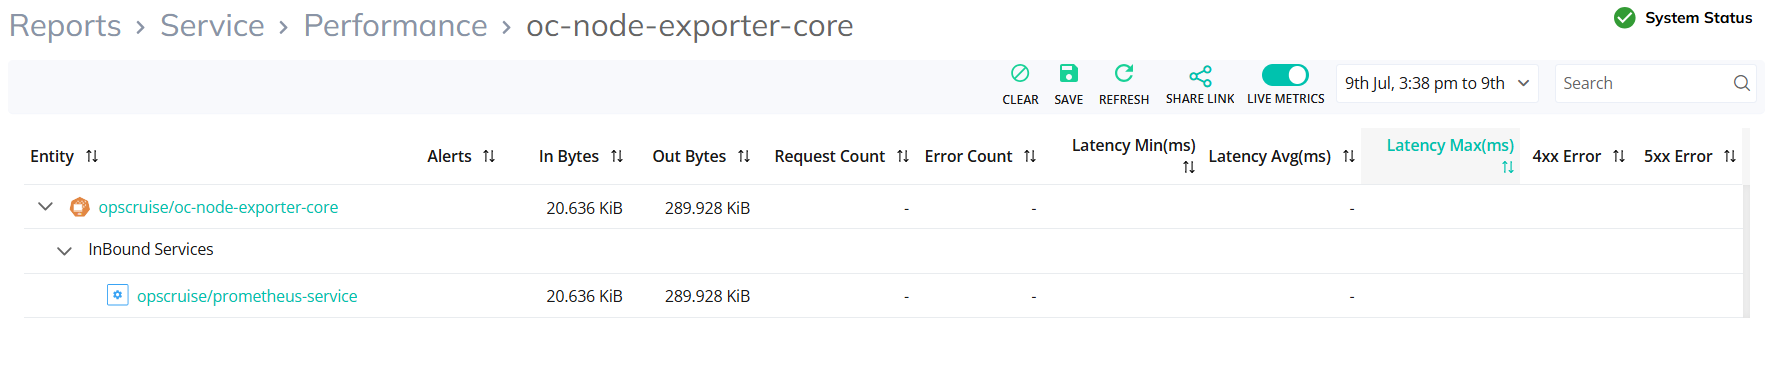
The list of services represents the traffic (L4 network level data), incoming and outgoing bytes and packets with latency, request count, and error count.
In Service performance, you can also view URL metrics (L7 level data) in terms of traffic requests made through HTTP protocols between services. Also, you can view the request HTTP URLs between the services.
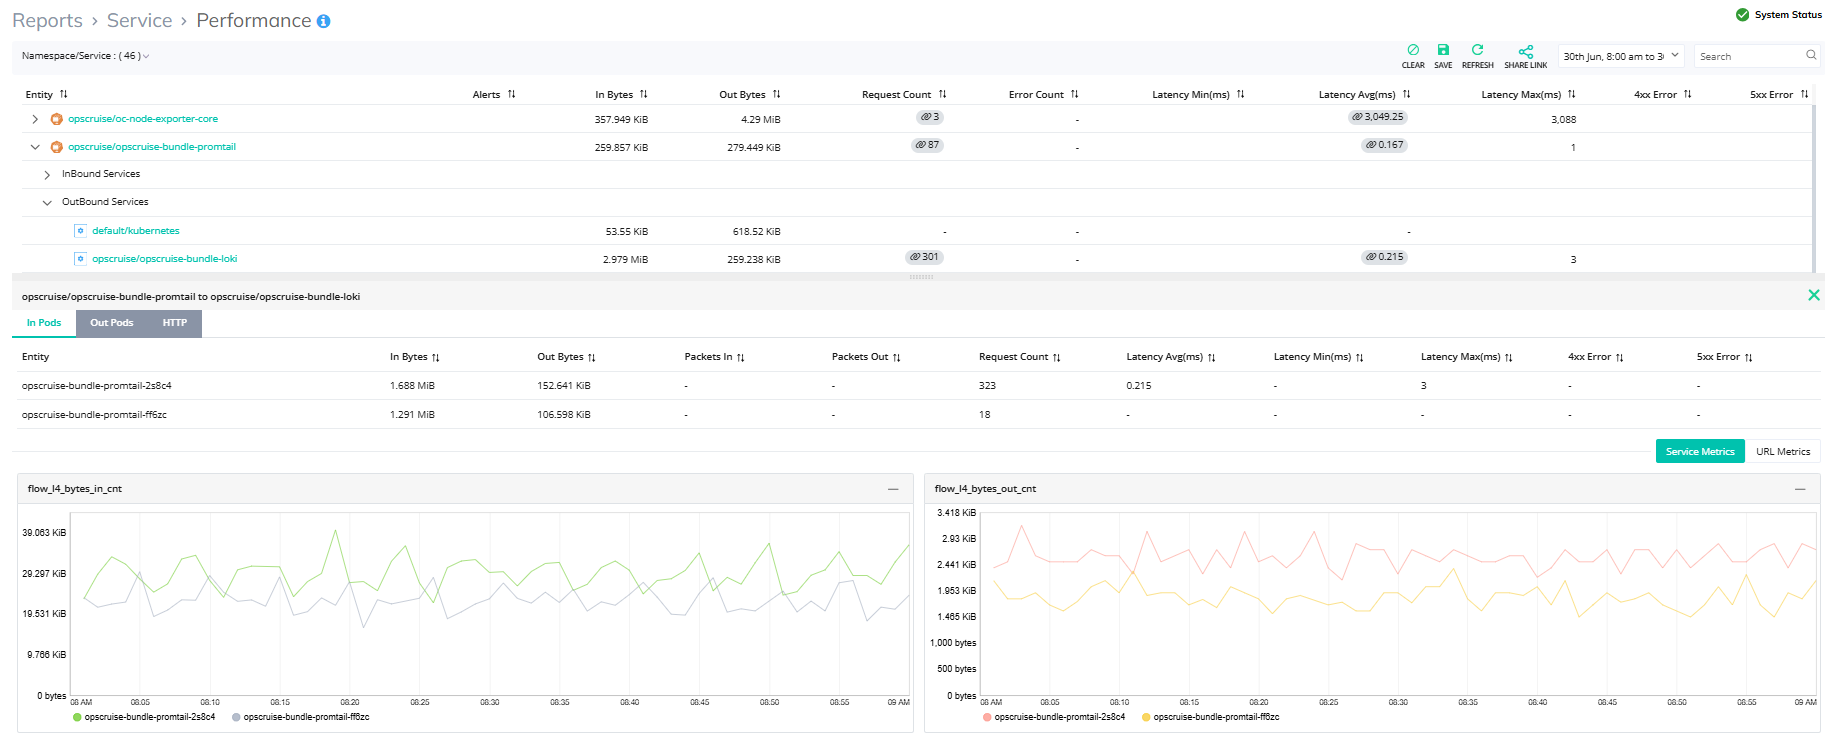
Click any entity to expand the following request URLs to a particular service.
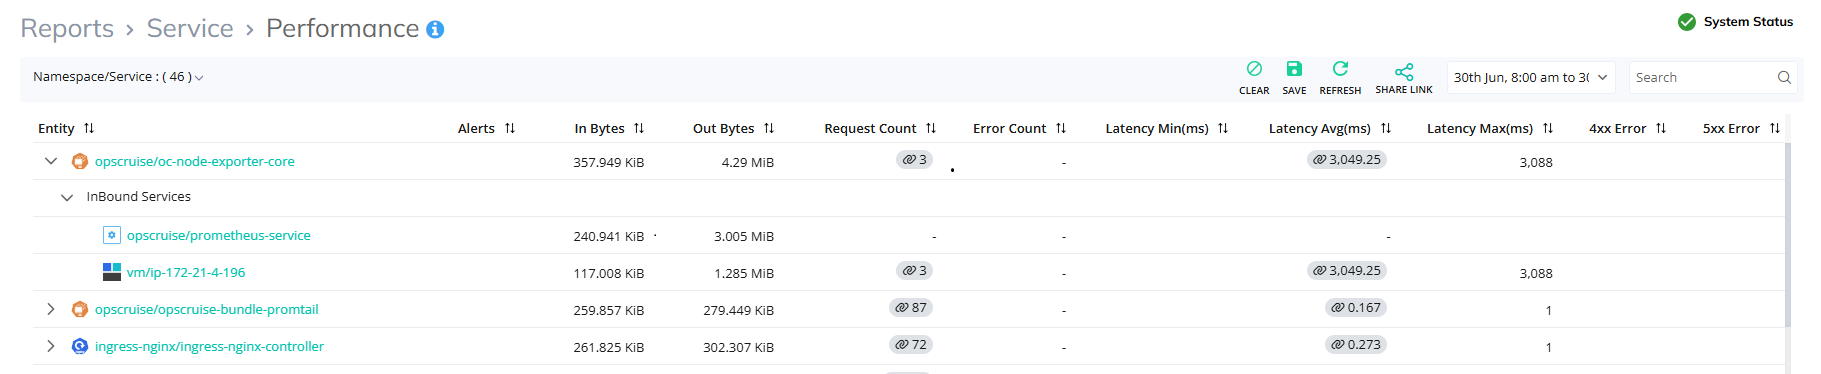
Represents several request counts made to the service in terms of URL with latency.
Click a URL to view the metrics in widgets:
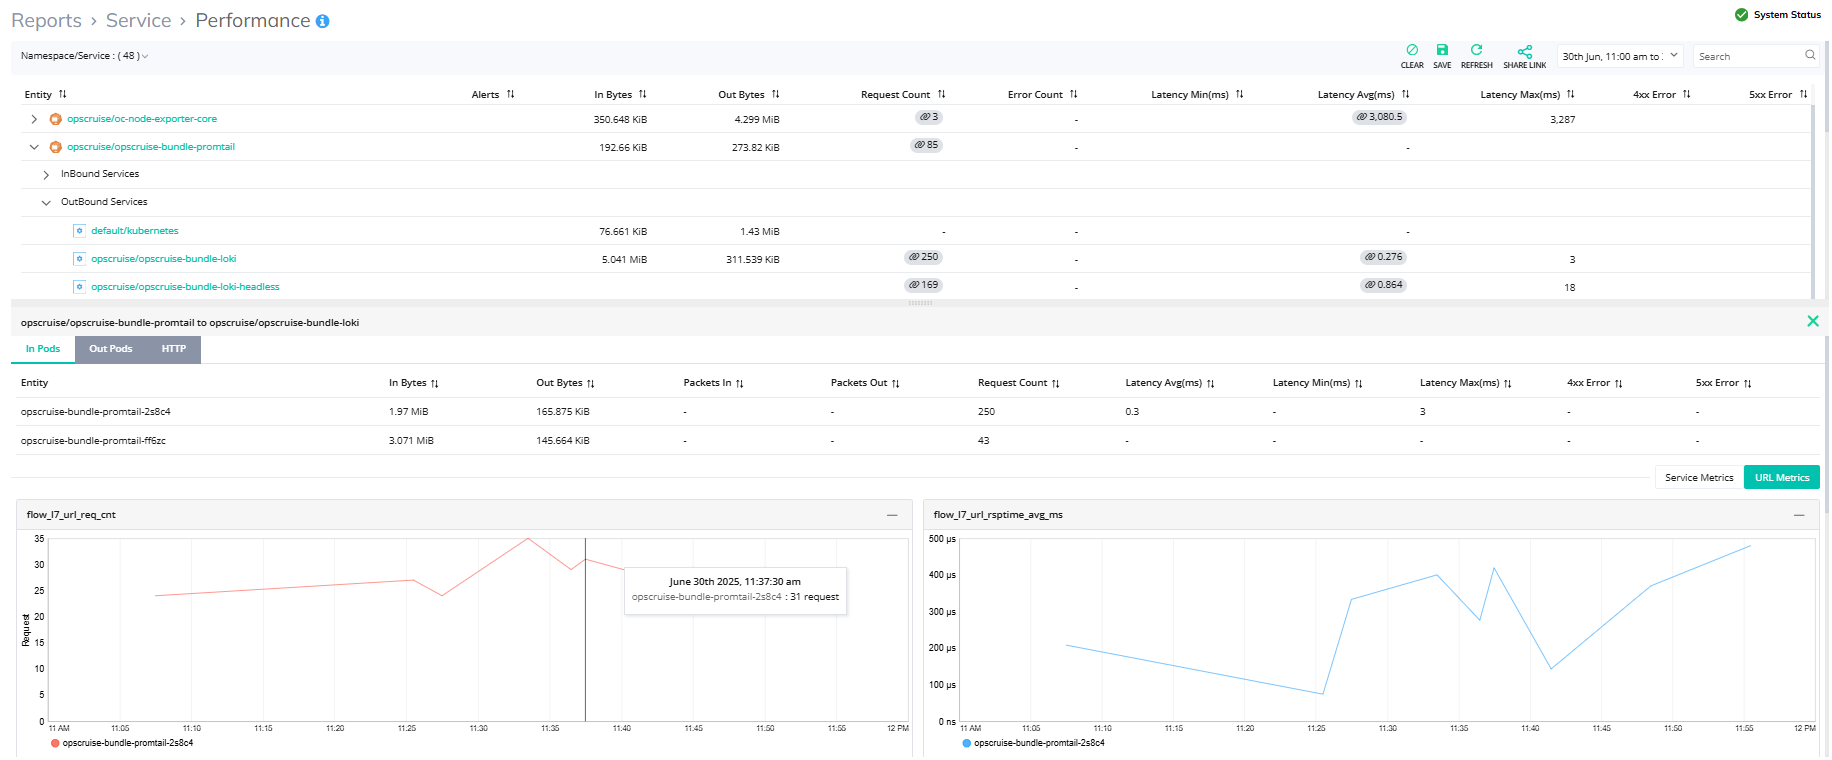
Widget represents the metric of URL, when hovered on the graph, it represents the request count made to the service at each time interval.
You can view details of the service performance minimum of one hour for the selected namespace.
If you need the details of the nearest time frame, follow the steps:
Click the required entity under Namespace/service.
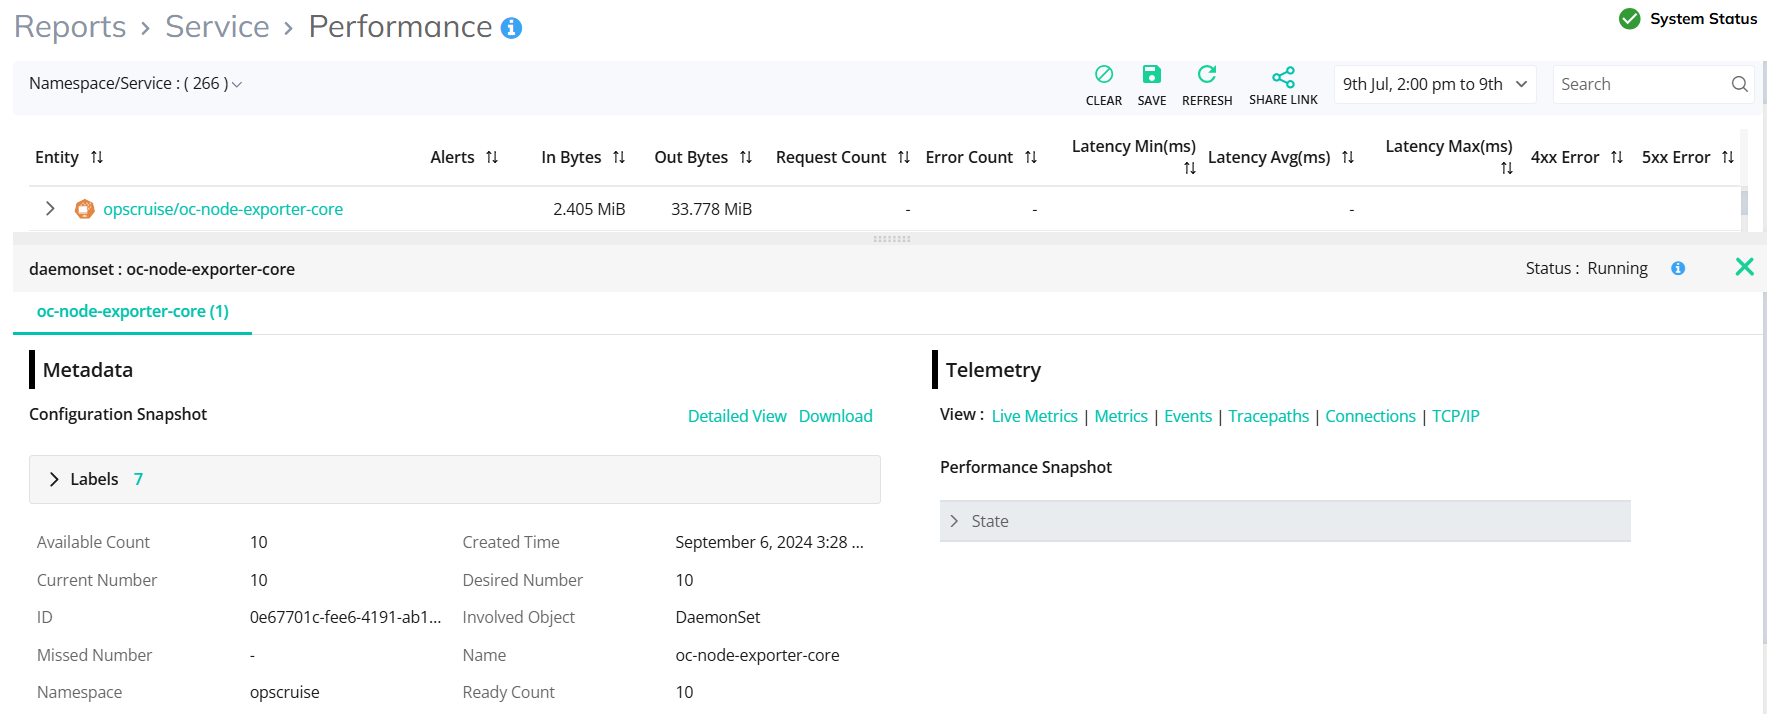
Under Telemetry, click Live Metrics.
It will display details of the selected entity with enabled Live Metrics.
Select the Timeframe as follows:
Last 5 minutes
Last 15 minutes
Last 30 minutes
Last 1 hour