Trace Maps
This topic is about Container Observability’s support for distributed tracing (DT). The Trace Map presents distributed tracing data in multiple formats, helping you visualize how requests traverse across services and operations, while identifying performance bottlenecks, failures, or latency issues.
Traces are created for each transaction that is executed in an application, starting with the initial request from the external client. These traces are emitted by the application components as spans, representing each interaction between components.
Trace Spans are stored in systems like Jaeger and Grafana Tempo. Traces are very voluminous and are hard to use. Typically, Traces are used by app teams to debug a problem.
The Trace Map summary view includes the following tabs:
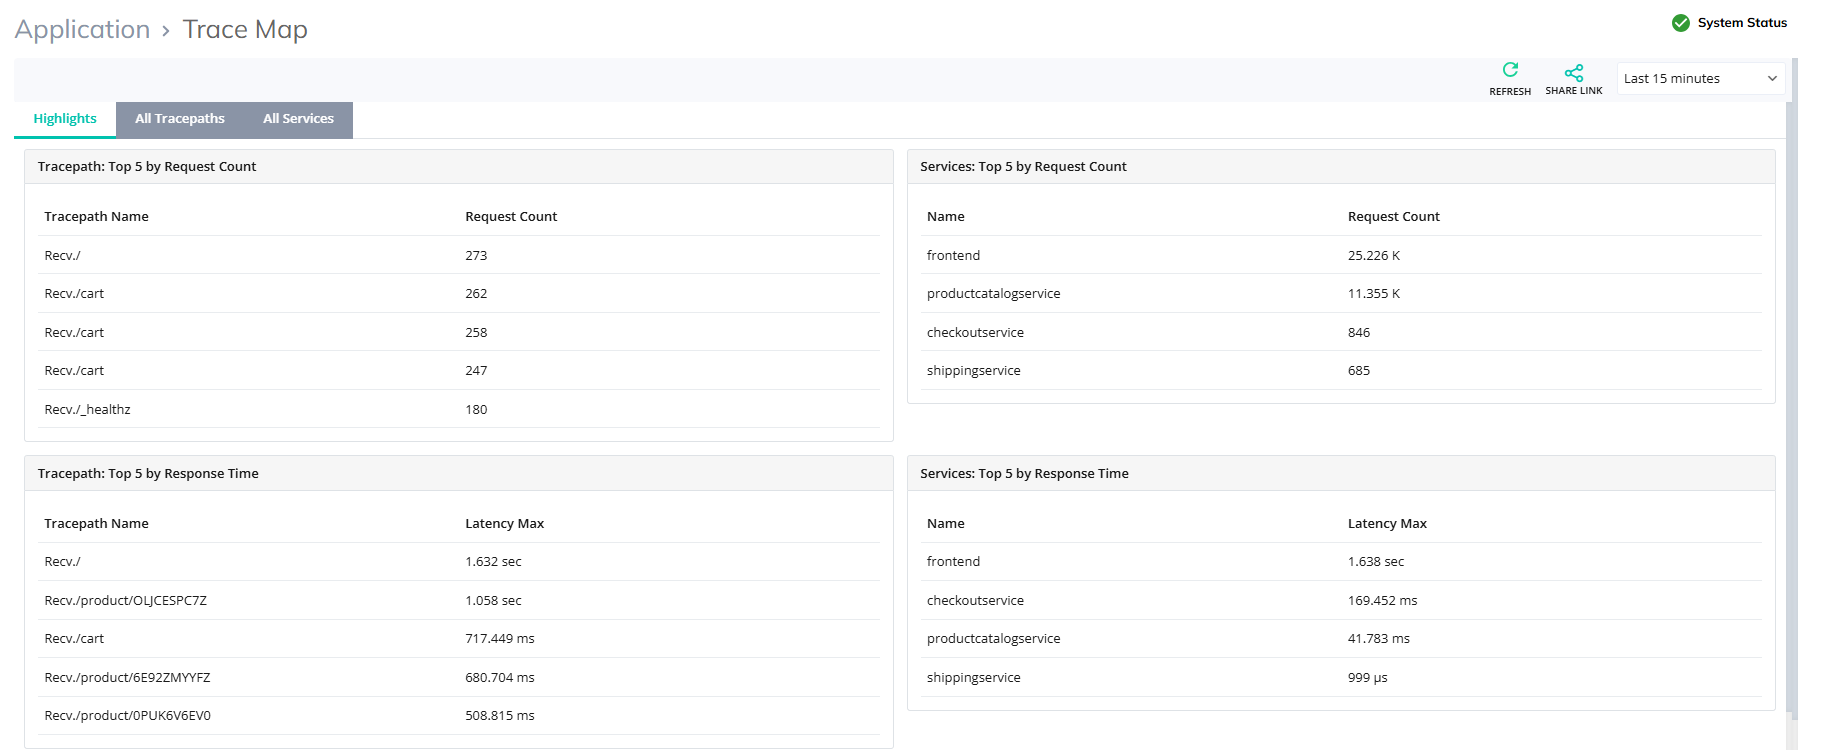
Highlights:
The Highlights tab summarizes the top Tracepaths by services and operations within the services. Using such summaries, you can find traces of interest within a specific time interval for a given Tracepath that contains specific services or service/operations, and helps you to detect if a trace is exhibiting any problems.
You can analyze the following from the Highlights:
The number of requests by volume from the root span into the Tracepath.
Response and Request time made per Tracepath and Service basis.
Errors occur during the request and response time of the traffic flow between the services and their operations.
Enables detecting problems or anomalous traces based on high latency or errors.
All Tracepaths: Lists different types of services with tracepath names. It also lists the number of operations involved between frontend services and microservices, displayed with data on request count made and response time taken to process the request from one service to another service module.
All Services: Lists microservices like shipping, product catalog services, etc, with data of several request counts made to each microservice from the frontend services and the max and average latency of response time taken to process by the microservices.