Layer 1: Configure AI agent tracing
Configure your AI agent application to send traces to the Virtana platform so you can monitor latency, errors, and service dependencies in Global View.
Before you begin
Enable Virtana Platform tracing in Enable tracing for Container Observability to deploy the trace gateway before you configure agent tracing. Agent tracing requires that the gateway be deployed and running.
How agent tracing works
Your application sends OpenTelemetry (OTel) traces to the Virtana trace gateway, which forwards them to the Virtana platform. To identify a trace as an AI agent trace, the platform checks for specific resource attributes. When the required attributes are present, the platform tags the trace automatically and displays the agent name in Global View.
Adding these attributes to your traces is the only difference from standard Virtana Platform tracing. The rest of the process is the same.
The following table describes the components involved in agent tracing.
Component | Description |
|---|---|
AI agent application | You add the agent resource attributes to this application’s OpenTelemetry resource configuration. |
Virtana trace gateway | Receives traces from your application and forwards them to the Virtana platform. Set up as described in Enable tracing for Container Observability. |
Virtana Platform | Receives tagged trace data and makes it visible in Global View, Traces, and Trace paths. |
Set the agent attributes
Add the following span attribute to your application’s instrumentation or agent configuration. Configure it so that the attribute is included with every span generated by the application.
Attribute | Example value | Purpose |
|---|---|---|
|
| Identifies the trace as an AI agent trace and sets the agent name displayed in the platform |
When this attribute is present in your trace, the Virtana platform automatically recognizes the source as an AI agent and displays it in the trace view.
Note
For the resource attributes required to link a trace to a Kubernetes pod, container, and deployment, see Enable tracing for Container Observability . Those attributes apply to all Virtana platform tracing, not only to AI agent traces.
Verify that your agent appears in traces
After you add the attributes, confirm that the platform is recognizing your agent correctly. This verification follows the same process as standard Virtana platform tracing.
To verify that your agent appears in traces:
Send a test request to your AI agent application. For example, send a query to your model endpoint.
Sign in to the Virtana Platform.
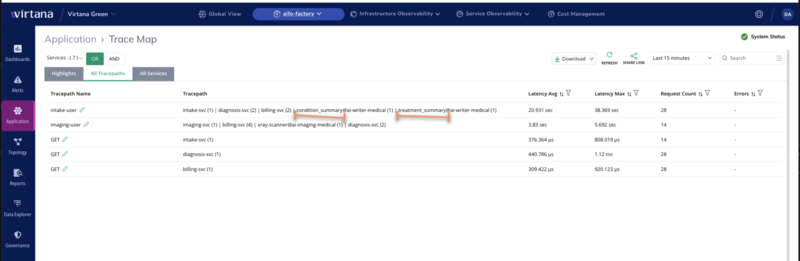
Navigate to Container Observability > Applications and select TraceMap.
It will display the Highlights, All Tracepaths, and All Services tabs.
Under the All Tracepaths, select the agent name you set as the attribute value.
Confirm that a trace appears with the correct agent name. The trace displays the request path, latency, and span details for each step your agent performed.
Note
If your agent does not appear after two minutes, confirm that the virtana-agent attribute is set correctly in your application’s resource configuration. Check that the name and value match exactly, including case.
You can see the agent trace view in the Virtana Platform after the resource attribute is correctly configured. The agent name, request path, and span latency are visible in the Traces view.
 |
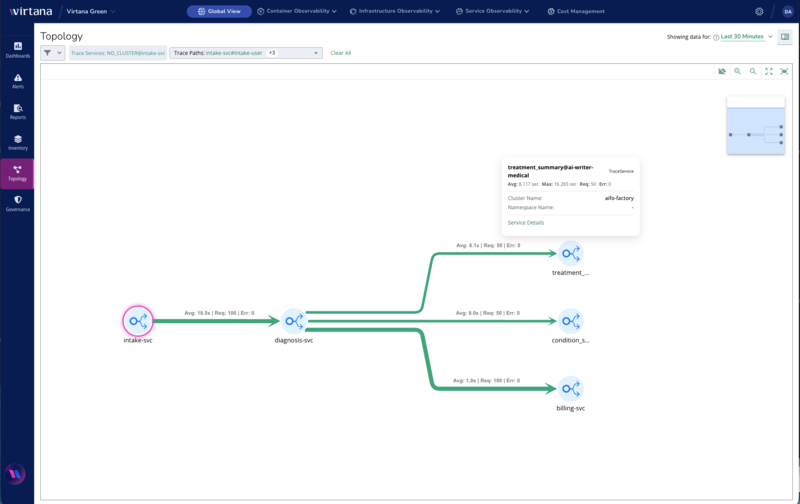
You can see the Topology view which shows the agent call chain from intake through diagnosis to downstream services, with per-hop latency and request counts.
 |