Metrics
This section helps users to view the metrics of volume, average latency, maximum latency, and error count through widgets by choosing the selected time frame in Container Observability.
To choose the required time frame, follow the steps:
To see the Metric, follow the steps from Viewing the Configuration Snapshot of each service operation.
Click on Metrics.
A list of widgets will display with metrics data.
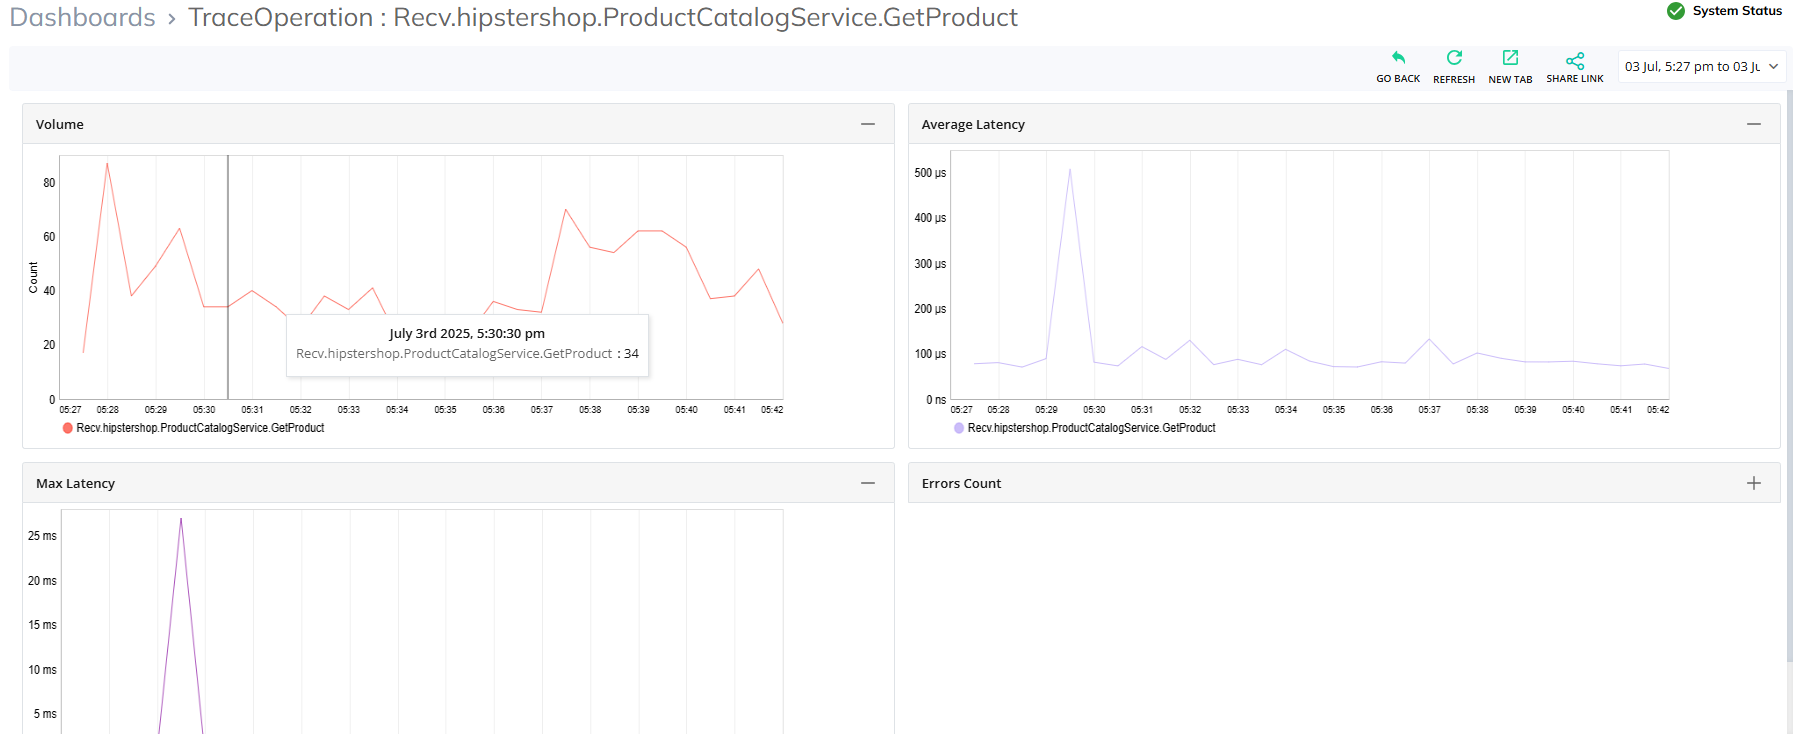
Choose a previous date, month , or hours and then click Apply.
Metrics of the selected time interval will be displayed through widgets.