Storage Admin Dashboards
The Storage Admin Dashboards present health, utilization, and performance data for storage infrastructure components.
The dashboard is available for FC SAN, Isilon, NAS, SDS, and PowerMax integrations.
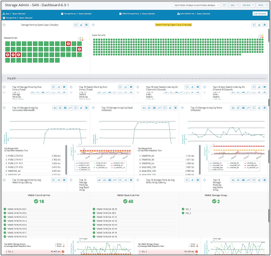
Report Variables
You can filter the report for an application, storage array, inter-switch link, or storage port. Use the filters to drill down on a specified infrastructure component.

Report Sections
The report is divided into eight sections:
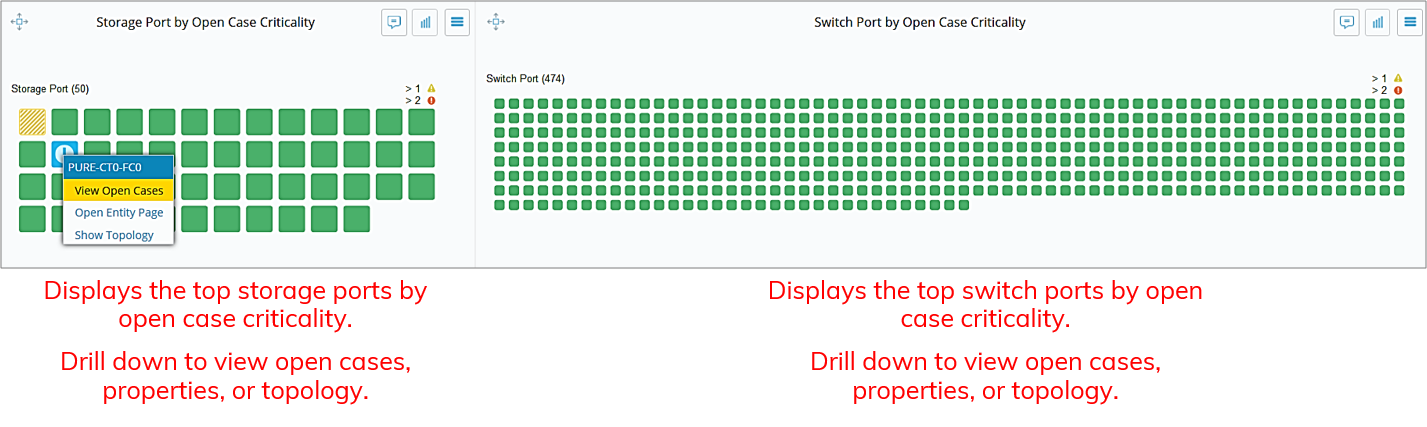
Storage Overview
Use the Storage Overview section to quickly observe where problems exist in the FC SAN infrastructure. View open cases to use the investigations to troubleshoot and remediate issues. Note entities with issues to use to filter the report.
FC SAN Health
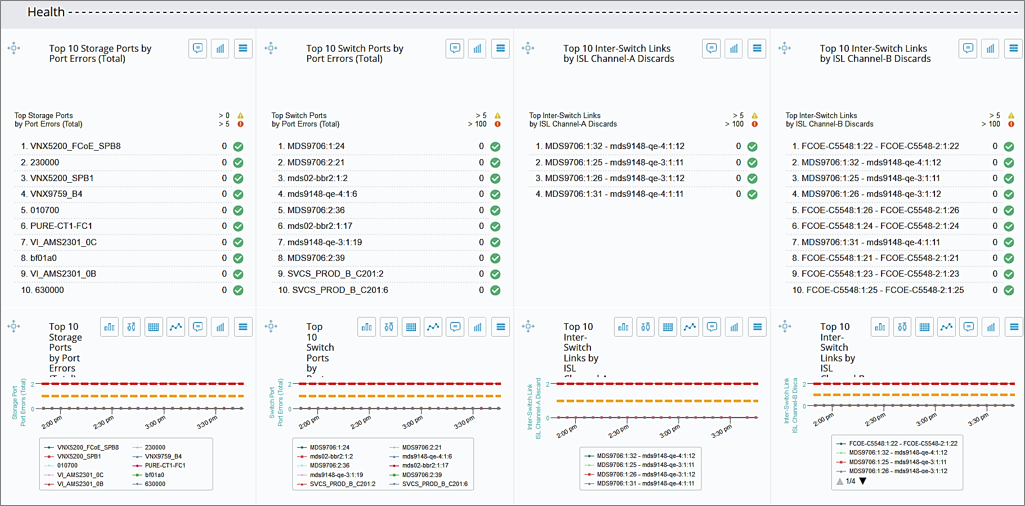
This section is filtered by application and/or storage port and shows you where port errors and Class 3 Discards are occurring for storage ports, switch ports, and inter-switch links.
List card and trend charts are displayed for each entity type and metric. Drill down on entities in the list views for more information and target these entities for physical layer issue investigation.
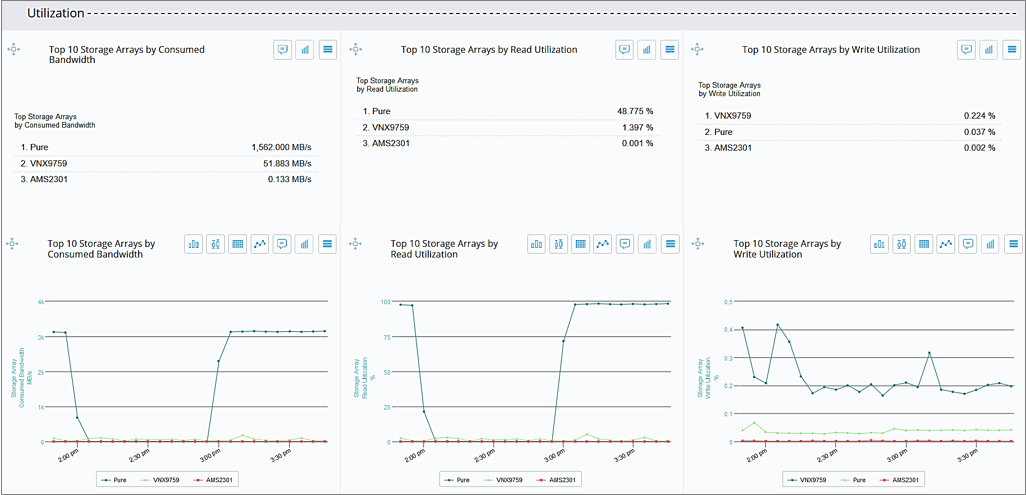
FC SAN Utilization
This section is filtered by application and shows you utilization data for storage arrays.
Consumed bandwidth
Read/write utilization
List card and trend charts are displayed for each entity type and metric. Drill down on entities in the list views for more information. Target these entities for workload balance and capacity investigation
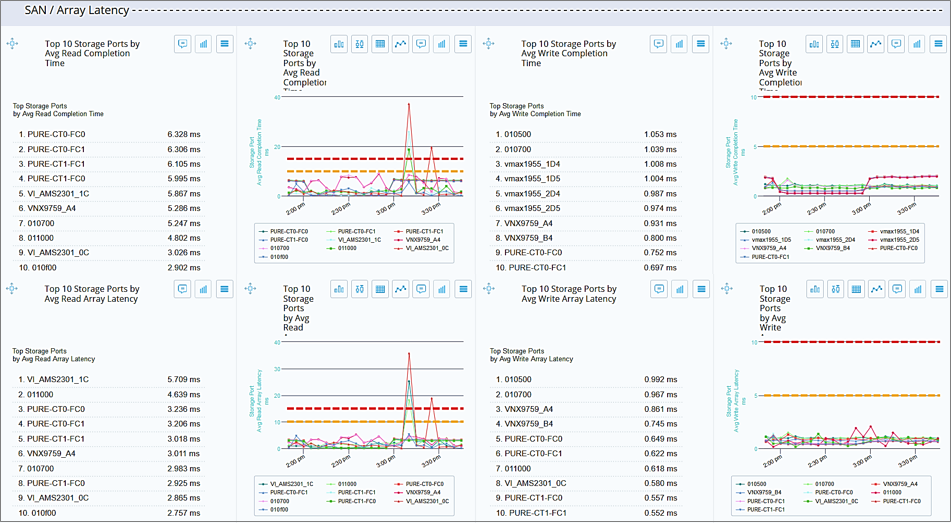
FC SAN Array Latency
This section is filtered by application and storage port and shows you performance data for storage ports.
Average read/write completion time
Average read/write array latency
List card and trend charts are displayed for each entity type and metric. Drill down on entities in the list views for more information. Target these entities for flow control investigation.
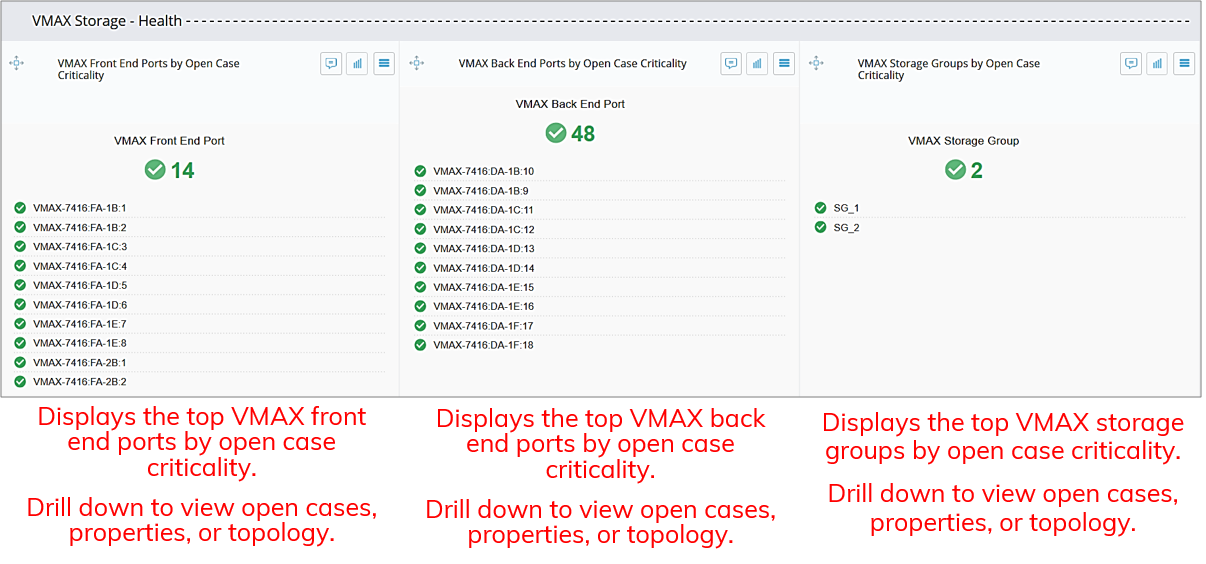
PowerMax Storage Health
Use the PowerMax Storage Health section to quickly observe where problems exist in the PowerMax infrastructure. View open cases to use the investigations to troubleshoot and remediate issues. Note entities with issues to use to filter the report.
PowerMax Storage Utilization
This section is filtered by PowerMax storage array and shows you utilization data for PowerMax front end and back end ports.
Port utilization
Write pending slot utilization
RDF utilization
List card and trend charts are displayed for each entity type and metric. Drill down on entities in the list views for more information. Target these entities for workload balance and capacity investigation.
PowerMax Performance/Latency
This section is filtered by PowerMax storage port and shows you performance data for PowerMax front end ports and storage groups
Average read/write response time
Average read/write array latency
List card and trend charts are displayed for each entity type and metric. Drill down on entities in the list views for more information. Target these entities for investigation.
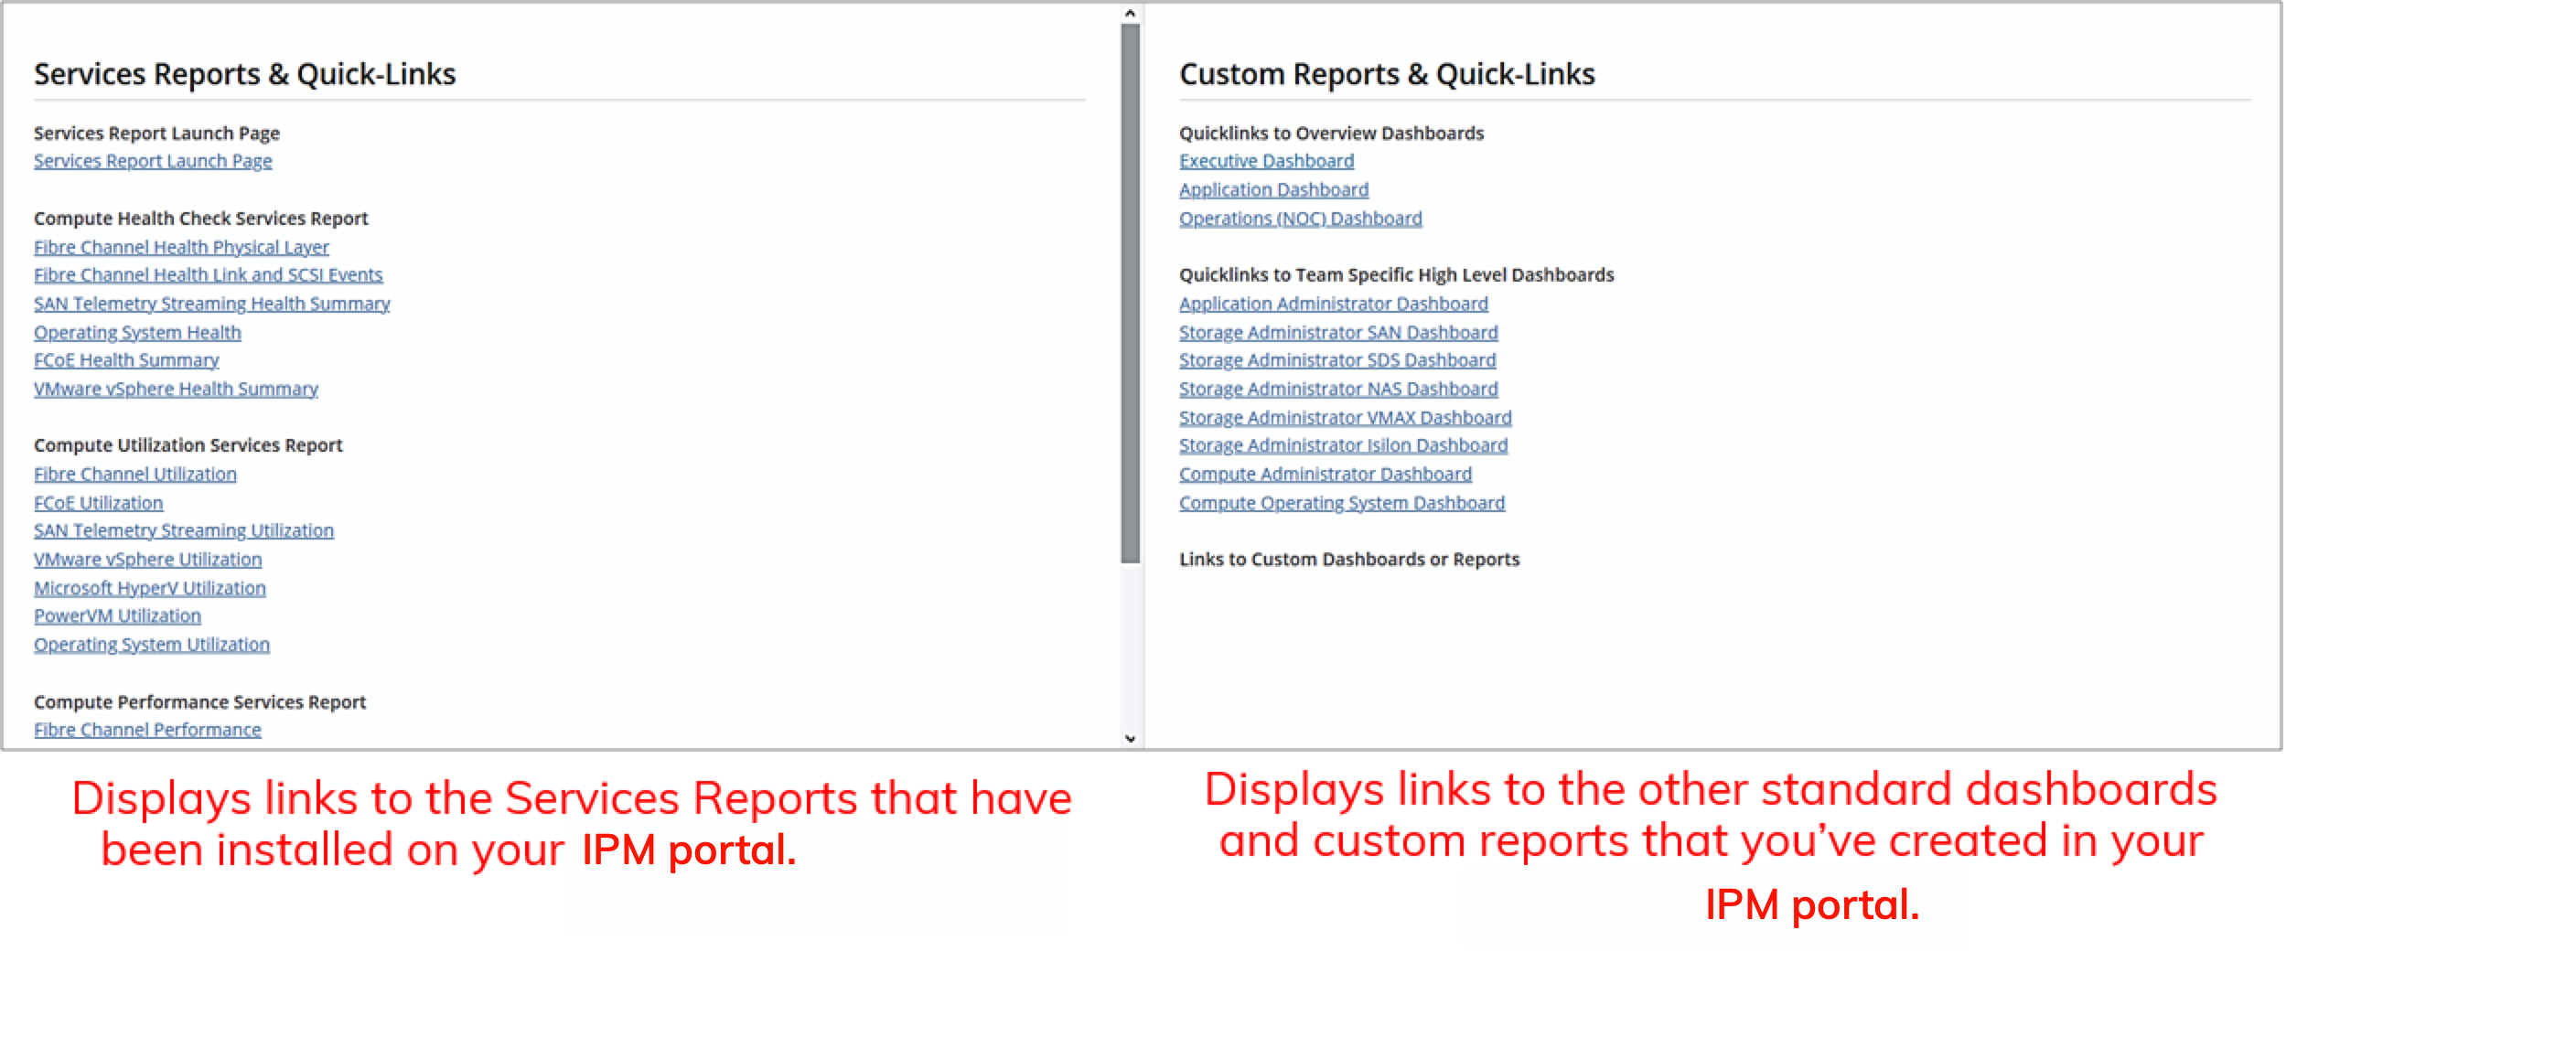
Report Quick Links
Use this section to view additional reports and dashboards.