Data point aliases
Performance reports pull information from various data points that represent a metric. The report itself knows which data points it requires,and which modifications are needed, if any, to put the data in its proper units and format.
The addition of a data point requires changing the report.
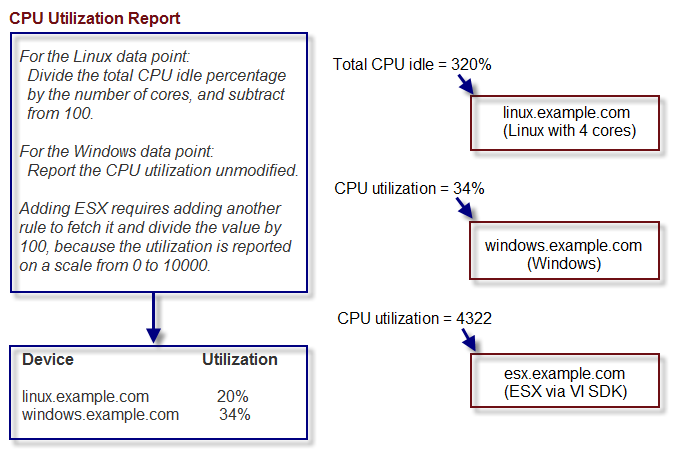
To allow for more flexibility in changes, some reports use data point aliases. Data point aliases group data points so they can be more easily used for reporting. In addition, if the data points return data in different units, then the plugin can normalize that data into a common unit.
An alias-based report looks up the data points that share a common alias string, and then uses them. This approach allows you to add data points without changing the report.
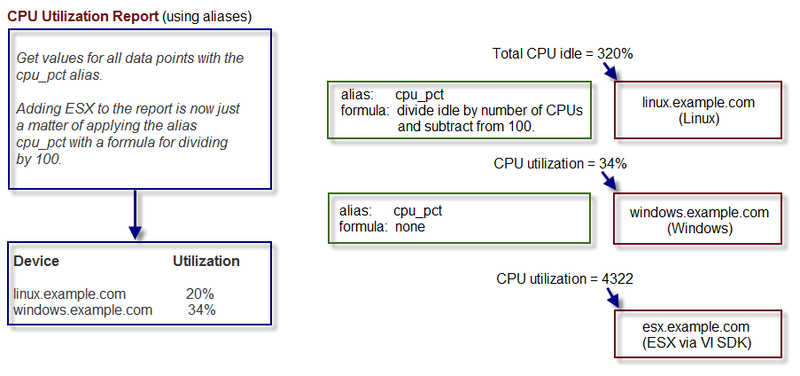
In the simplest cases, data from the target data points are returned in units expected by a report. For cases in which data are not returned in the same units, an alias can use an associated formula at the data point. For example, if a data point returns data in kilobytes, but the report expects data in bytes, then the formula multiplies the value by 1024.
Alias formula evaluation
The system evaluates the alias formula in three passes.
Pass 1: Reverse polish notation
When complete, the alias formula must resolve to a Reverse Polish Notation (RPN) formula.
In RPN, the formula to convert kilobytes into bytes is:
1024,*
For more information about RPN formulas, refer to RPN documentation.
Pass 2: TALES expressions
For cases in which contextual information is needed, the alias formula can contain a TALES expression that has access to the device as context (labeled as "here"). The result of the TALES evaluation should be an RRD formula.
In TALES, the formula to convert kilobytes into bytes is:
${here/hw/totalMemory},/
Pass 3: Python expressions
You also can embed full Python code in an alias formula. The code must construct a string that results in a valid RRD formula.
To signal the system to evaluate the formula correctly, it must begin with:
__EVAL:
In Python, the formula to convert kilobytes into bytes is:
__EVAL:here.hw.totalMemory + ",/"
Adding a data point alias
To add an alias to a data point:
Navigate to a data source on a monitoring template.
Double-click a data point in the list to edit it. The Edit Data Point dialog box appears.
Enter the alias name and the formula.
Note: If the data point returns values in the preferred units, then leave the Formula value blank.
Click Save.
IP service monitoring
The INFRASTRUCTURE > IP Services page lets you manage and monitor IP services that are running on your network. Monitored IP services are tested with a simple TCP client to ensure they are listening and responding appropriately. IP service monitoring also has the ability to send a clear-text command to a TCP port (similar to doing the same in telnet manually) and evaluate the response with a regular expression pattern.
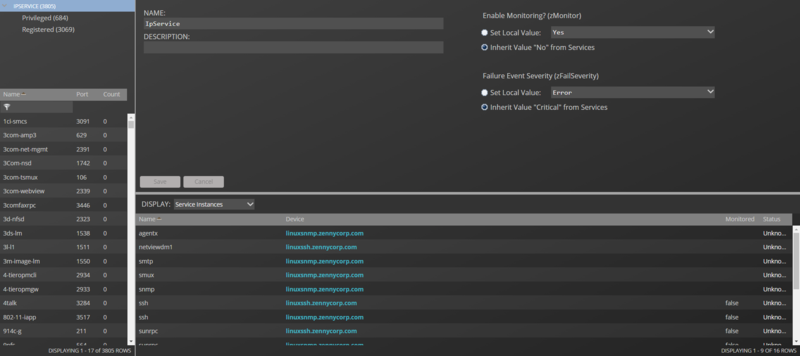
The tree view lists all monitored IP services. Filter this list by using the active search area at the top of the view.
The details area shows:
Service class description
TCP port
Associated service keys
To add or change details for a service class, enter or change information, and then click Save.
The lower section of the page lists currently running services in this class (by device), and shows their monitoring status. You can also display Configuration Properties by selecting that from the drop-down list.
Enabling IP service monitoring
You can choose to monitor individual services or service classes.
When monitoring a service class, you can choose not to monitor one or more individual services in the class. For example, the SMTP service class is monitored by default, but may not be a critical service on some devices. In this case, you can disable its monitoring on those devices.
Note
If a service is configured to listen only on local host (127.0.0.1), then it is not monitored by default.
When adding a new IP service that uses a port value higher than 1024, you need to increase the value of zIpServiceMapMaxPort to a number higher than the port you are monitoring.
To enable monitoring for a service class or service:
In the tree view, select the service class or service to monitor.
Make one or more selections:
Enable Monitoring (zMonitor) - By default, Inherit Value is selected for all services below the IPService node. When selected, the service class or service will inherit monitoring choices from its parent. If you want to individually enable monitoring choices, select the Set Local Value option, and then select a value.
Failure Event Severity (zFailSeverity) - By default, Inherit Value is selected for all services below the IPService node. When selected, the service class or service will inherit severity level choices from its parent. If you want to individually select severity levels, select the Set Local Value option, and then select a value.
Click Save to save your choices.
Using the predefined /Server/Scan device class
The predefined /Server/Scan device class is an example configuration for monitoring TCP services on devices using a port scan. If you have a device that you want to monitor for service availability alone, you can place it under this device class. The system will not collect performance data for devices in this class.