Working with Alerts
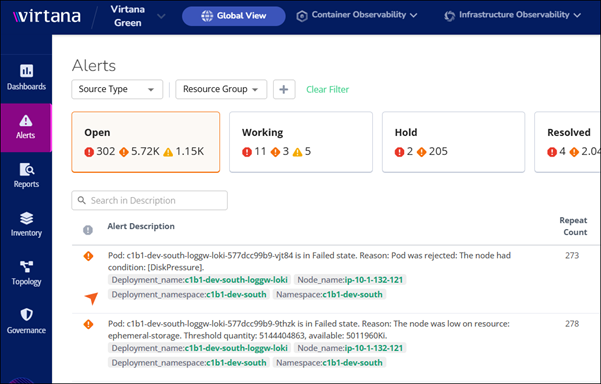
When you open the Alerts page in Global View, you can drill down into your alerts to better understand the cause of the problem. Click an alert to view more information about the root cause, the impacted entity, and other details to help you take action on the alert.
The Alert Page is divided into three tabs:
Overview: Use this tab to quickly view what happened to trigger the alert for the impacted entity. From here, you can drill down into metrics, view related activity, and explore topology to help in your investigation.
Troubleshooting: In this tab, you can find detailed information and insights to aid in troubleshooting the alert. This may include diagnostic data, suggested actions, and relevant contextual information to help resolve the issue efficiently.
Properties: In the Properties tab, you can view a snapshot of the alert properties and a history of the alert, such as when it first and last occurred, and how long the alert has been active.
To view each tab in detail, see Tabs in the Alert page.
Open Alerts
To access the Alert Page, perform the following steps:
Navigate to Global View.
In the left side menu, select Alerts, and click the impacted alert under Alert Description.
A detailed alert page opens for the selected alert.
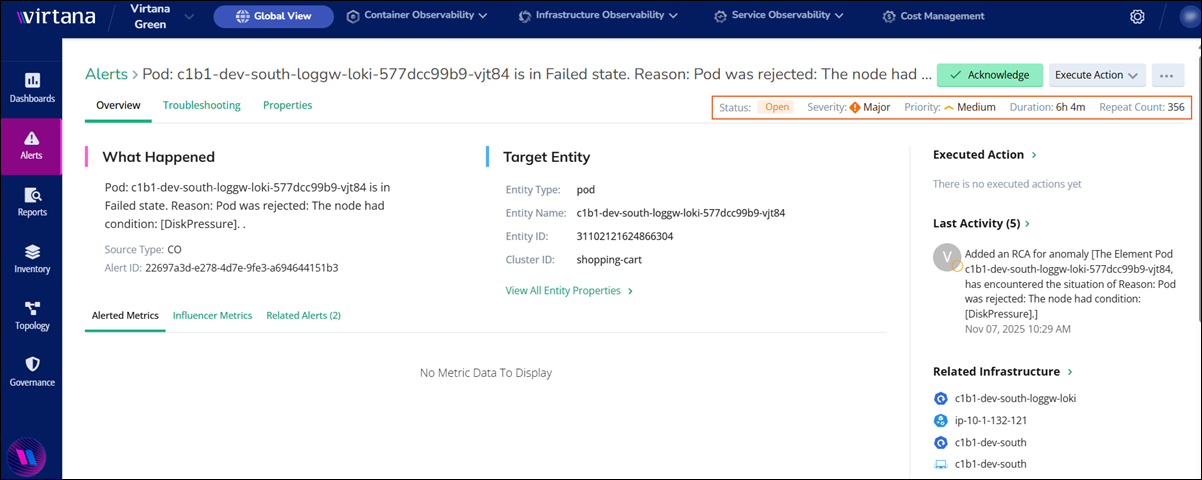
You can view the following details on the detailed alert page:
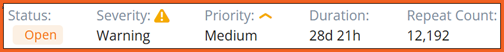
Alert Detail | Description |
|---|---|
Status | Indicates whether the alert is open, closed, acknowledged, or in progress. |
Severity | Represents the level of impact or urgency associated with the alert, like critical, major, or minor. |
Priority | Determines the importance or order in which the alert should be addressed. |
Duration | Shows the time elapsed since the alert was triggered. |
Repeat Count | Indicates the number of times the same alert has occurred within a specified timeframe. |
In alerts, you have several actionable options:
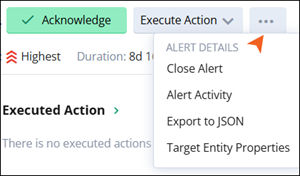
Acknowledge
Execute Action
Alert Details
You can view the additional options, such as Close Alert, Alert Activity, Export to JSON, and Target Entity Properties in the Alert Details (
 ).
).
Acknowledge alerts
When an alert is generated within the Global View platform, it often requires attention from relevant personnel to investigate and resolve the underlying issue. The Acknowledge function provides a mechanism for you to formally acknowledge your awareness of the alert without necessarily resolving it immediately.
Execute actions for alerts
You can trigger predefined or custom actions directly from the alert interface. These actions might include running diagnostic scripts, initiating remediation workflows, or integrating with external systems. This automation accelerates response times and reduces manual intervention. Execution status is displayed in the UI and logged for future reference. To view more options to customize your alert action, see Executing Different Actions.
Close Alert
Once the issue is resolved, you formally close the alert. This process typically requires you to provide a resolution note or select a closure reason, ensuring that the alert’s lifecycle is fully documented for future reference and compliance.
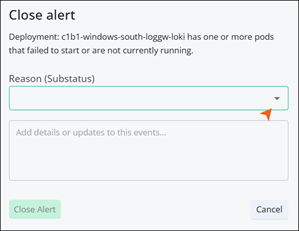
You can select the predefined reasons, such as Cancelled, Closing, Done, Fixed, and NoFix from the dropdown.
View alert activity
At any point, you can review the alert’s activity log, which details every action taken, status change, and user involved. This transparency supports auditing, post-incident reviews, and continuous improvement.
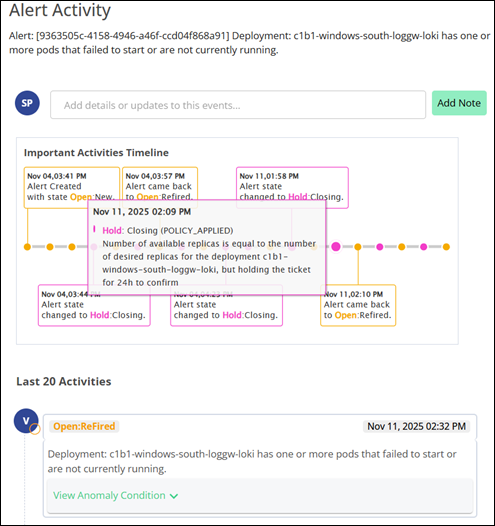
Hover over the Important Activities Timeline to view the alert detail description for a particular time and date.
You can view the last 20 alert activities under the Important Activities Timeline. Click View Anomaly Condition to view and analyze the alert occurrence time, target, and other details.
Add a note to save it in recent activities for future reference.
Export alert details
JSON exports can be downloaded or sent to external systems via APIs. For integration with other tools or for archival purposes, you can export the alert’s details in JSON format. This ensures compatibility with a wide range of systems and supports advanced analytics or compliance requirements.
View entity properties
Throughout the alert’s lifecycle, you have access to detailed properties of the entity that triggered the alert. This includes metrics like CPU usage, memory utilization, and network activity, enabling you to diagnose and resolve issues efficiently.
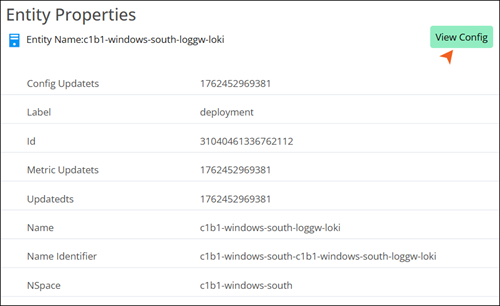
Entity data is retrieved from configuration management databases. To view the entity configuration, click View Config.
Metrics and Logs in the Alert
The Alert Details page provides several tabs to help you investigate the root cause of an alert and understand the behavior of the affected entity. These tabs allow you to correlate performance metrics with system events and logs.
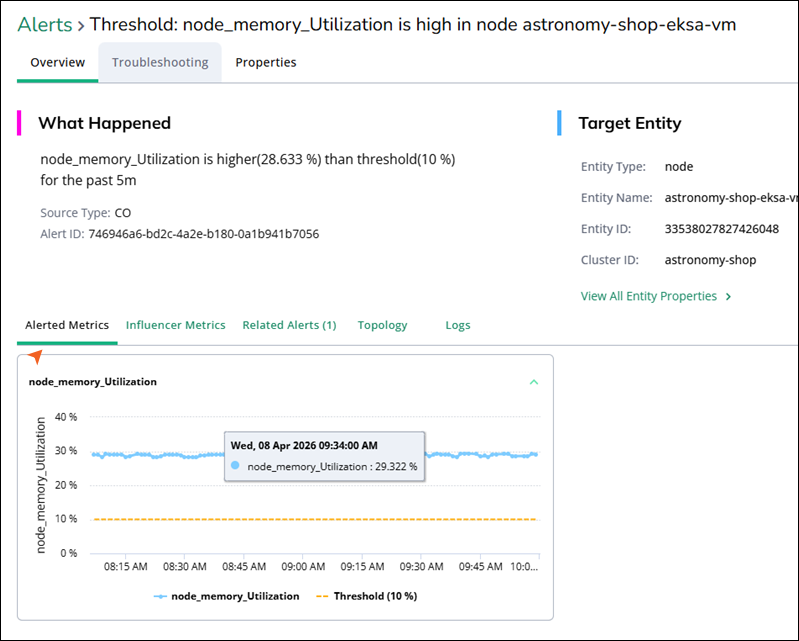
Alerted Metrics
The Alerted Metrics tab displays the specific metric that triggered the alert. It features a time-series graph showing the metric’s performance against the configured threshold (represented by a dashed line). Hovering over the data points provides precise values and timestamps. This view helps you to identify if the breach was a momentary spike or a sustained trend over the duration of the alert.
Influencer Metrics
The Influencer metrics view shows time‑series charts for metrics that are closely related to the alert. Metrics are grouped by entity type. Use the tabs (for example, Node, Containers, Pods) to switch between entities that are associated with the alert target.
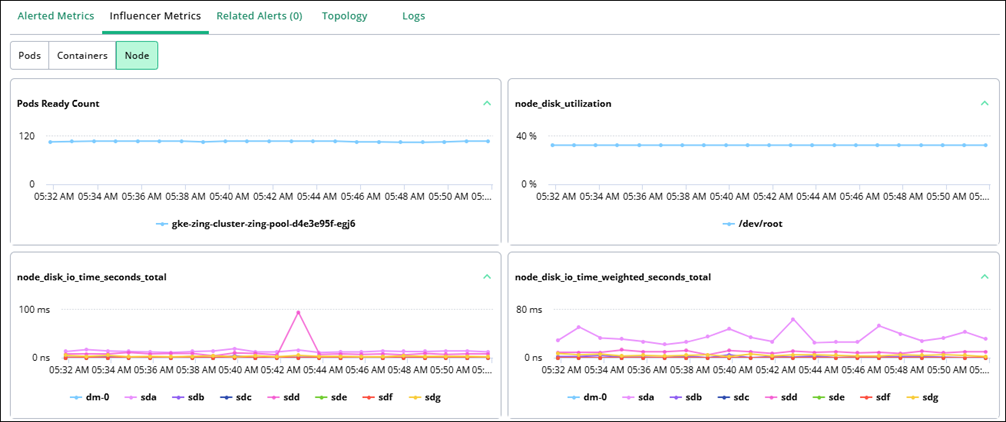
For each entity type, the page shows multiple charts over the same time range as the alert so that you can visually correlate trends. Each chart displays the metric values for the specific entity instance. You can view these metrics to identify changes that occurred around the same time as the alert and help you understand the underlying cause.
Related Alerts
The Related Alerts tab shows other active or recent alerts occurring within the same cluster, namespace, or related infrastructure. This tab is crucial for determining if an issue is isolated to a single entity or if it is part of a systemic failure across the specific cluster.
Topology
The Topology tab provides a visual map of the infrastructure and service dependencies related to the alerted entity. You can view the connection between the target entity and the other services, pods, or nodes within the cluster. It lets you identify which upstream or downstream services might be affected by the current alert.
Logs
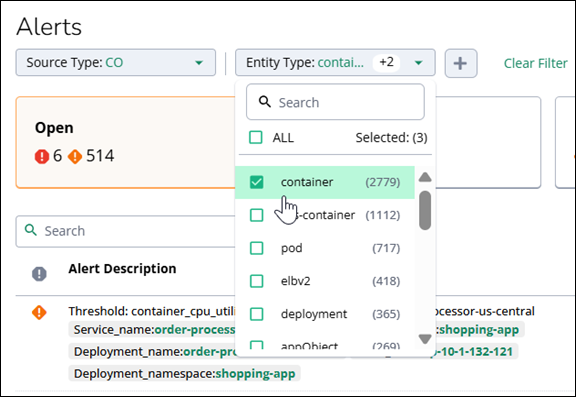
The Logs tab provides a direct view into the telemetry and system messages generated by the affected entity during the alert window. To view the Logs tab, you must first filter your CO alerts by a specific entity type. This helps you narrow down the data to exactly what you need to investigate. You can select a filter by following entities, such as Container, Node, Pod, and Host. By selecting one of these types, the system can retrieve the specific logs associated with that part of your infrastructure.
Each log entry includes a timestamp, namespace, and the specific pod name. You can use the search bar to look for specific error codes or keywords within the log stream to accelerate troubleshooting. Use the drop-down filter above the table to select any entity type, such as Container, Pod, and Node, to focus on specific components.
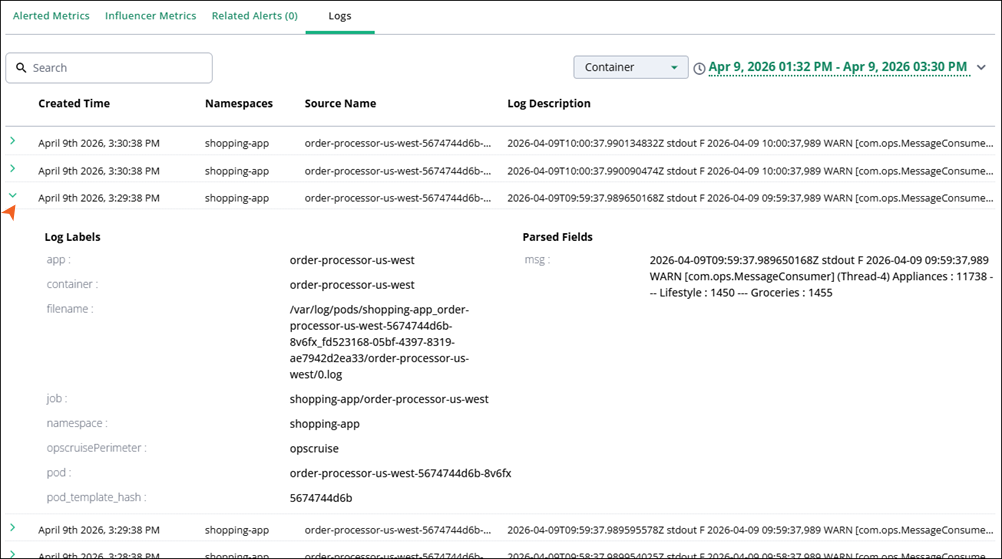
Select a log entry in a table to expand the log labels and parsed fields, providing granular metadata such as app version, file path, and custom fields, which can help you identify if the issue is tied to specific segments or transaction types.
The log entries list table includes the following columns:
Column name | Description |
|---|---|
Created Time | Timestamp when the log event was generated. |
Namespaces | Kubernetes namespace of the workload. |
Source Name | Name of the source emitting the log (for example, the container or application name). |
Log Description | Short description or message preview. |
Note
If you open CO by clicking a link in a pod or container log, the timeframe you see might be based on the current time. This means the window might not automatically show the exact time the log was recorded.
When the gap between updated time and created time is greater than two hours, Global View sends a fallback window to CO as end time and current time are the same, and start time could be 2 hours less than the current time. Because of this, you might see a time difference between the logs timeline in Global View and the timeline shown in CO.
The detailed log context for the selected entry includes:
Log Labels: Key values attached to each log entry that describe the Kubernetes or infrastructure context, such as namespace, pod, container, and application labels. These help you quickly identify where the log originated and group related log events.
Parsed Fields: Structured fields automatically extracted from the raw log message, such as msg, status codes, or business attributes. These make it easier to filter, search, and analyze logs based on specific values instead of scanning unstructured text.