Cisco SAN Integration
Collect port health and utilization statistics.
 |
The Cisco SAN Integration is an agentless software solution that utilizes storage and network information from SNMP MIB (management information base) to gather switch performance and link error statistics in a non-intrusive manner. These switch statistics are correlated with other system-wide metrics, as well as metrics from other integrations. This integration supports Cisco Fibre Channel switches and creates an unbiased view of switch port performance. IO utilizes the data collected to track switch performance, identify oversubscribed resources, conduct historical trending analysis, and alert administrators of link error problems or performance bottlenecks. Mini-discovery requires that scheduled discovery be enabled on at least one Cisco SAN integration.
To collect FCoE metrics from Cisco switches, configure the Cisco SAN Integration to use SNMP Version 2c or 3, and leave SNMP GetBulk Operation enabled (do not click the checkbox).
Note
Occasionally, a switch might time out while collecting FCoE metrics. If this happens, increase the polling interval to allow the switch more time to process the metrics.
Prerequisites
You can configure Cisco SAN Integration for SNMP discovery.
For HBA card-HBA port associations to be discovered, the following conditions must be met, in this order:
Cisco SAN Integration needs to be set up to monitor the same environment as Microsoft Hyper-V Integration, IBM PowerVM Integration, and VMware vSphere Integration.
Cisco SAN Integration full discovery (either scheduled or manual) must have completed prior to the Microsoft Hyper-V Integration, IBM PowerVM Integration, or VMware vSphere Integration full discovery (either scheduled or manual).
If this order is changed or these conditions are not met, HBA ports are displayed without their HBA card associations.
Configuring an integration for SNMP Discovery
Note
If your switches use ACLs, you must add the IO Platform IP address to those configurations.
Note
Switches that have an IPv6 address on the mgmt0 interface should not be configured for use with this integration.
From the Settings screen, click Integrations in the Probes and Integrations section.
The Integrations screen displays.
Click View under Cisco SAN.
The Cisco SAN screen displays.
The column headings in the main part of the screen are defined as follows:
Column Heading
Definition
Name
User-defined name for the integration, often the integration IP address or the type of integration. For example, Brocade_BNA_27, or seed_switch_1.
Subscription
Unsubscribed or Subscribed.
For Cisco SAN Integration and Brocade SAN Integration only, if subscribed, shows a ratio of the number of configured switches that are subscribed/the total number of configured switches. For example, 1/5 means that one configured switch is subscribed, out of 5 possible configured switches.
Last Discovery
Date and time that the integration was last discovered, discovering for currently discovering, no discovery, Discovery failed, or Warned. For Discovery fail or discovery Warned, you can mouse over the cell shows the error or warning as a tool tip.
Last Metrics Collection
Date and time of last metrics collection, Collecting metrics for metrics collection in progress, Metrics collection failed for failed metrics collection, followed by a ratio of the number of failed subscribed switches to total subscribed switches, no collection for no metrics collection, or Warned followed by a timestamp and with no ratio, for a warning. For both failures and warnings, there is no mouse-over tool tip and the user has to drill down and see the failures /warnings in the switch grid.
You are notified if an integration fails to collect metrics for two hours. The notification takes the form of a IO Health Notification as well as an email notification.
At the end of each row is a down arrow, which, if you click it, provides a short cut to Configure, Test Connection, Start Discovery, or Delete the integration in the associated row.
Click New.
The New Cisco SAN screen displays.
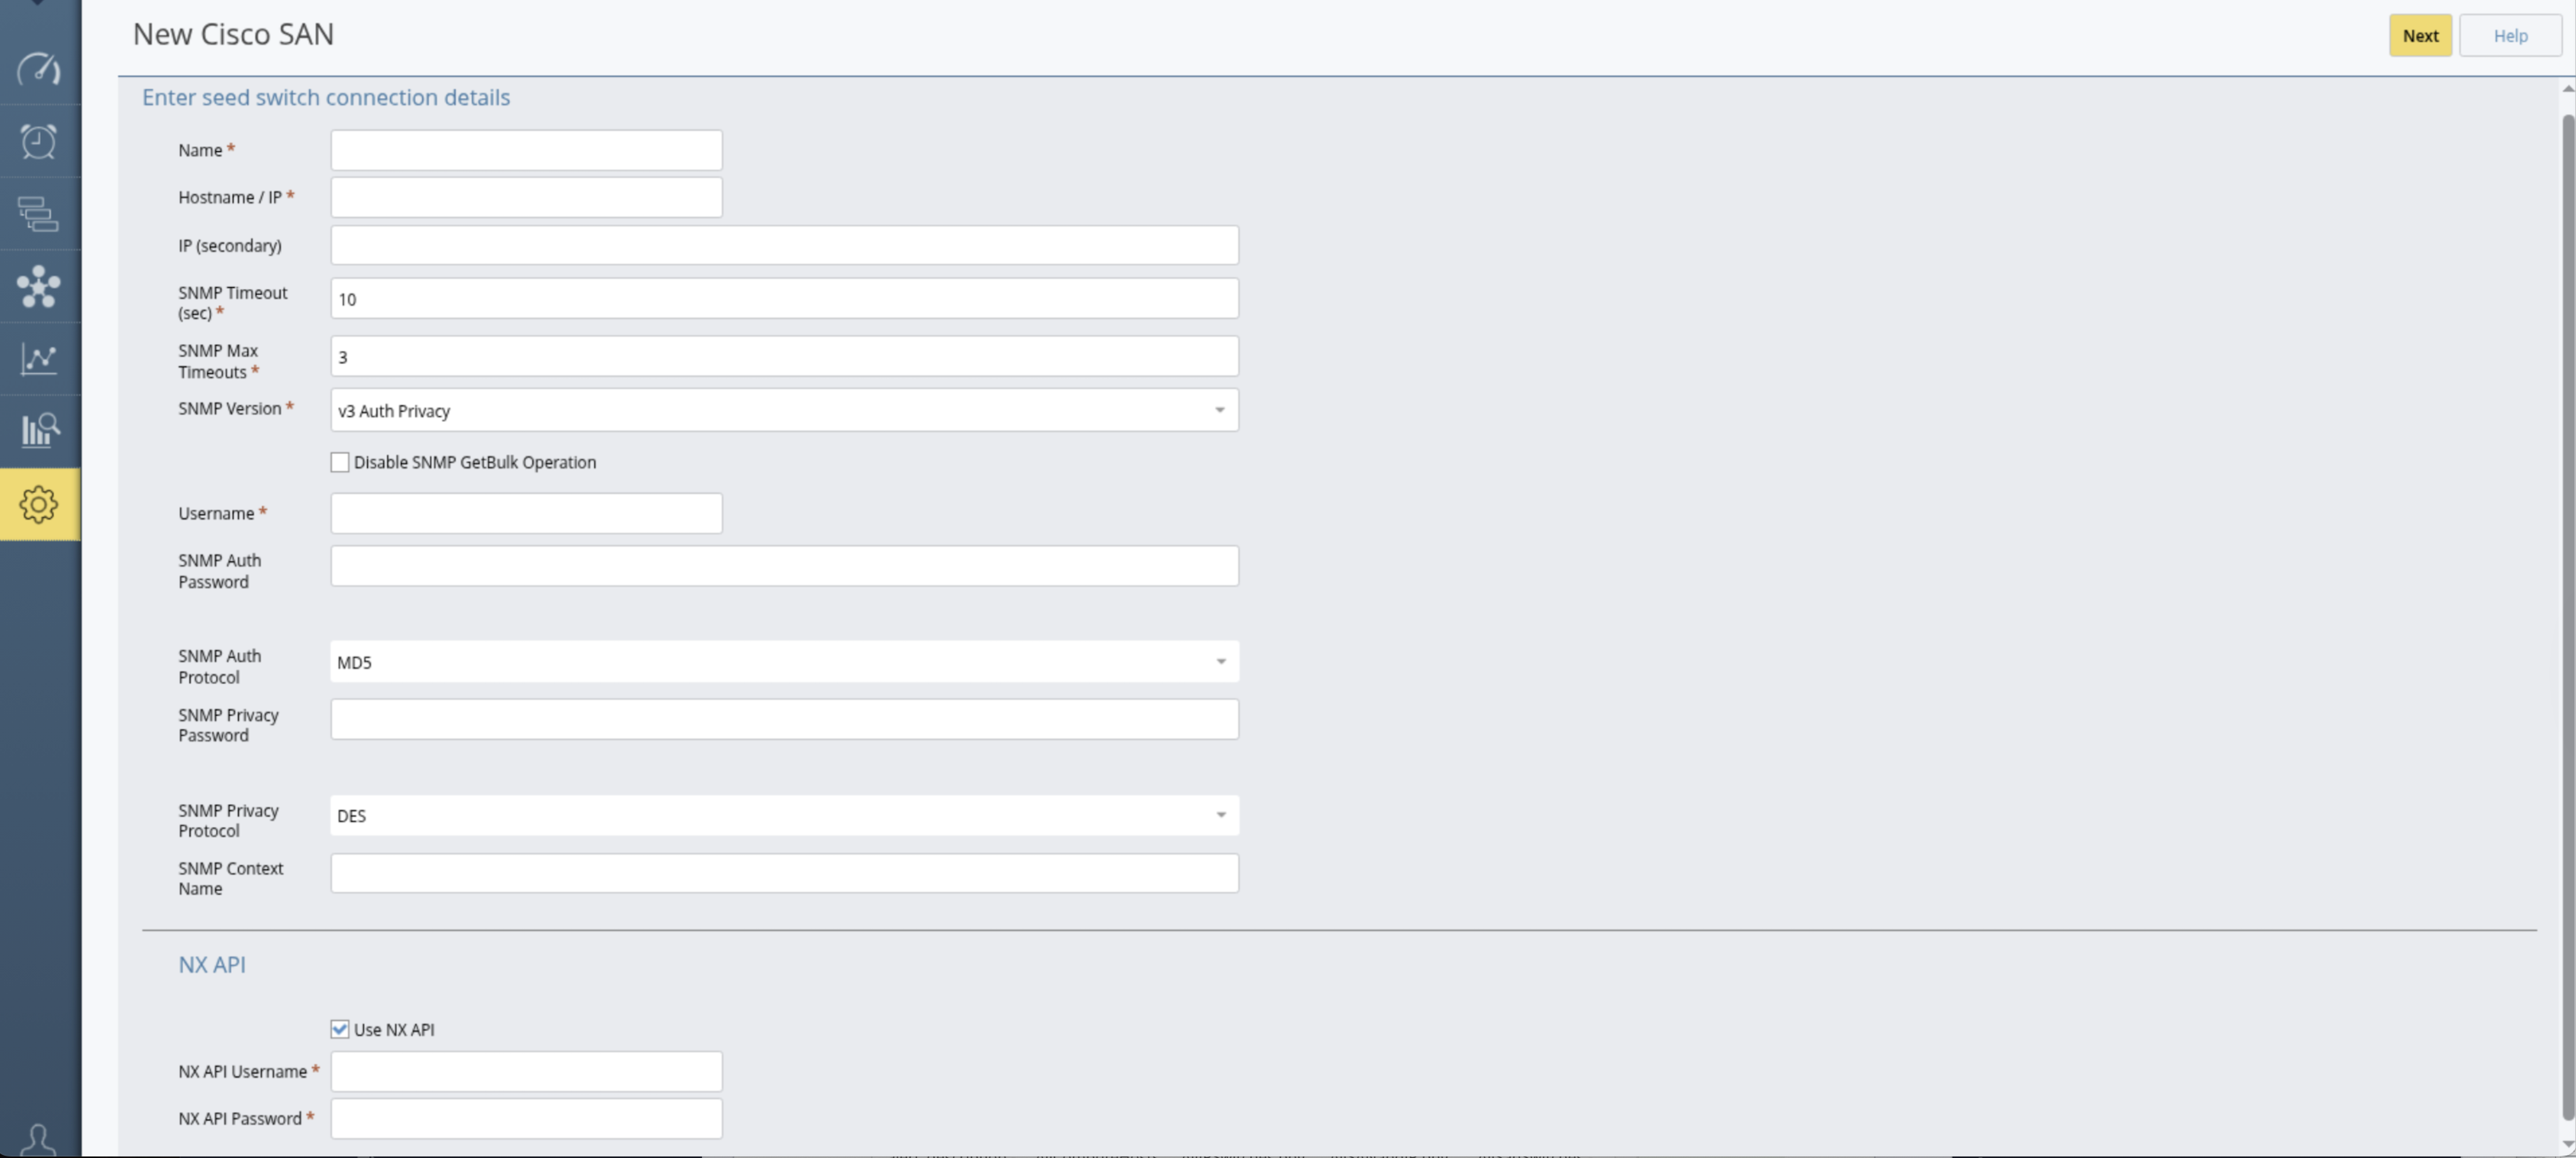
Enter the details for a Cisco seed switch connection:
Note
An NPV-enabled switch cannot be used as a seed switch.
NX API Details:
Use NX API {checkbox}: Select this checkbox to enable metric collection via the NX API.
NX API Username: Enter the username required for NX API authentication.
NX API Password: Enter the corresponding password for NX API authentication.
Cisco seed switch details:
Name for the integration discovery instance
The Name field can be edited after the configuration is saved.
Hostname/IP as an IP address
Optional IP (secondary) as an IP address
SNMP Timeout (sec)
SNMP Max Timeouts
SNMP Version (v1, v2c, v3 Auth Privacy, v3 Auth No Privacy, v3 No Auth No Privacy)
Community: Default is public
Enable or disable the Disable GetBulk Operation check box
Depending on the SNMP version detected, there might be more or fewer values to enter.
Click Next.
IO tests the connection to the seed switch and tries to find all of the switches accessible from that seed switch. This process can take up to five minutes. When the process completes, the Create New Integration screen displays.
The Vendor, Hostname / IP, Secondary IP, and SNMP version details are carried over from the previous screen. The Name field is user configurable.
Enter the integration Name.
Regularly scheduled discovery is enabled for Cisco SAN Integration and Brocade SAN Integration configurations by default. You can specify the Frequency and Time of Day of discovery. Uncheck the Enable scheduled discovery check box if you would like to disable regularly scheduled discovery.
You can also enable Mini Discovery (disabled by default) and specify the frequency in minutes. If you disable (uncheck) scheduled discovery, Mini is also disabled.
If mini discovery is disabled, full discovery discovers and detects changes in FCIDs for both FC Ports and Proxy FC Ports.
If mini is enabled:
Full discovery does not discover FCIDs for FC Ports or Proxy FC Ports.
Mini discovery discovers FCIDs for FC Ports or Proxy FC Ports immediately after the first full discovery finishes, and then associates FCID with FC Port.
Mini discovery detects changes in FCIDs and updates existing FCIDs.
Optionally, click Test Connection to test the connection.
The switches in the Switches table on the Create New window are those switches that were auto-detected.
You use the information in the Switches table to configure/unconfigure and subscribe/unsubscribe specific switches.The columns headings in the Switches table are defined as follows:
Table 234. Switches Table FieldsFields
Definition
Switch Name
Auto-detected name of the switch.
Port Count
Active port count.
Status
Discovered, Configured, Subscribed.
Last Metrics Collection
Date and time of last metrics collection, Collecting metrics for metrics collection in progress, metrics collection failed, or no collection for no collection.
You are notified if a software integration fails to collect metrics for two hours. The notification takes the form of a IO Health Notification alert as well as an email notification.
Metrics Polling Interval
Metrics polling interval set for the switch.
Error
Configuration or subscription errors. Mousing over an error displays a tool tip containing the error text.
At the end of each row is a down arrow, which, if you click it, provides a short cut to Configure, or Unconfigure the integration in the associated row.
Note
The seed switch cannot be unconfigured.
Select the switch or switches that you want to configure by selecting the check box associated with the switch or switches.
Click Configure, or, if you only chose one switch, you can also choose the Configure option from the drop-down menu at the end of the selected row.
If you selected one switch, the Switch Configuration dialog box displays. Proceed to Step 11.
If you selected more than one switch, the Bulk Switch Configuration dialog box displays. Proceed to Step 12..
If you select one switch, the Switch Configuration dialog box displays.
The Name, Vendor, Hostname/IP, and SNMPVersion are auto-detected. You can override the IP and SNMP Version. If auto-detect for the IP address failed, you must enter the IP address. Depending on the SNMP version detected, there might be more or less values to fill in.
The values in the other fields are filled out with default values. You can edit these fields, but it is recommended that you keep the default values provided. In some cases, such as when SNMP version 3 usernames and passwords are required, we cannot provide defaults, and you have to enter the information manually.
Note
SNMP Timeout multiplied by SNMP Max Timeouts cannot exceed half of the Polling Interval.
Note
For Core switches discovery times out, workaround is to increase the timeout value to 45 seconds and the metrics polling interval need to be set to 5 minutes, click OK and re-run the discovery.
Click OK to apply the configuration. Proceed to Step 13.
If you select two or more switches, the Bulk Switch Configuration dialog displays.
Select the properties that you want to configure and click OK.
A Switch Configuration dialog displays, with the selected properties ready to be configured. Enter the values for the selected properties and click OK to apply the configuration.
Subscribe to the switches by selecting the switch or switches to which you would like to subscribe and click Subscribe. When you click Subscribe, IO also validates that there are sufficient licenses.
Click Save to save all of your changes.
The Discovery dialog box displays, asking if you want the discovery process to start upon saving. Immediate discovery is recommended, as no metrics are collected until discovery is complete.
Click Yes to start immediate discovery.
After clicking yes, you get returned to the main grid of all software integration configurations, and the integration that you just created has "Discovering…" in its last discovery time column.
If you drill down into the integration configuration again, a banner displays on your screen saying that discovery is taking place. While the discovery is taking place you are in read-only mode. You cannot make any changes to the integration or switch configuration.
Note
If discovery completes with the error, “Illegal action: attempt to associate archived parent,” re-run discovery on the integration configuration that failed for it to unarchive the port.
Cisco SAN Integration Alias and Zone-Based Topology Matrix
Aliases are automatically imported during Cisco SAN Integration discovery if you are using any of the following supported combinations.
Vendor | Alias Type | Alias By | Zoned By | IO Naming* | IO Topology** |
Cisco | fcalias | wwpn | alias | yes | yes |
Cisco | fcalias | wwpn | wwpn | yes | yes |
Cisco | fcalias | fcid | fcalias, fcid | yes | yes |
Cisco | device-alias | wwpn | device-alias | yes | yes |
Cisco | device-alias | wwpn | wwpn | yes | yes |
Cisco | fcalias, device-alias | interface | interface | no | no |
* Retrieves alias definitions from the switches that are used for WWN-to-name resolution
** Retrieves zone information that is used to define the intelligent topology within IO
Cisco SAN Telemetry Streaming
The following are supported with SAN Telemetry Streaming: DS 9700 32G, DS-X9648-1536K9 Module and MDS 9132T Switch.
The Cisco switch supports monitoring SAN Telemetry Source (STS) storage data from licensed ports of target edge switches. ProbeFC supports approximately 500 metrics. The Cisco switch currently has 72 metrics available. These metrics are sent to the IO appliance using the gRPC protocol, and are available per Initiator-Target-LUN and port. With Compact-GPB encoding on NX-OS 8.3(2), Cisco limits 20K ITLs per 9100 switch and 40K ITLs per 9700 switch, and a minimum STS streaming interval of 30 seconds. IO supports 200K ITLs from multiple Cisco switches.
Cisco MDS NX-OS Release 8.3(2) supports Google Protocol Buffers (GPB) and GPB compact encoding over gRPC transport. Ensure you follow the appropriate steps below if using Cisco NX-OS Release 8.3(2). Virtana and Cisco recommend using GPB-compact encoding with IO and NX-OS 8.3(2).
To collect STS data from the MDS 9700 switch you need SAN_ANALYTICS_PKG or SAN_TELEMETRY_PKG, and for MDS9132T switch you need SAN_TELEMETRY_PKG.
Perform the following steps to configure analytics and telemetry on the switch:
Ensure all Cisco switches that will configured for telemetry streaming are NTP synced to the same source(s) as IO.
Enable analytics and telemetry globally:
feature analyticsfeature telemetryEnable the interfaces to collect data:
interface fc<x/y>analytics type fc-scsiNote
To improve performance, enable analytics only on the ports which need to be monitored. IO supports analytics on the storage edge switch port.
Configure a push query:
analytics query "select all from fc-scsi.scsi_target_itl_flow" name virtana_query type periodic clear differentialclearclears all the min, max, and peak metrcis after every query (streaming) interval. By default,min/max/peakvalues are sticky.differentialstreams only ITL records that have changing data. By default, every ITL record is streamed all the time.periodicis the streaming interval. The default streaming interval is 30 seconds.scsi_target_itl_flowshould be used for the target edge switch port.Choose one of the following to configure streaming for the query.
Configure streaming for IO and Cisco NX-OS 8.3(1):
MDS9706# configure terminal
MDS9706(config)# telemetry
MDS9706(config-telemetry)# sensor-group 100
MDS9706(conf-tm-sensor)# path analytics:virtana_query
MDS9706(conf-tm-sensor)# destination-group 100
MDS9706(conf-tm-dest)# ip address 10.10.60.97 port 5888 protocol gRPC encoding GPB <-Receiver IO IP address and port
MDS9706(conf-tm-dest)# subscription 100
MDS9706(conf-tm-sub)# snsr-grp 100 sample-interval 30000
MDS9706(conf-tm-sub)# dst-grp 100
Note
Use the following to remove the IO IP address as a gRPC receiver:
MDS9706# configure terminal
MDS9706(config)# telemetry
MDS9706(config-telemetry)# destination-group 100
MDS9706(conf-tm-dest)# no ip address 10.10.60.97 port 5888
protocol gRPC encoding GPB <-Receiver IO IP address and port
Note
The default server port on the IO appliance to receive STS metrics is 5888. If port 5888 is unavailable, use port 5889 or 5890 to receive the STS metrics from the switch.
Follow these steps to change the port on the switch from 5888 to 5889:
MDS9706# configure terminal
MDS9706(config)# telemetry
MDS9706(config-telemetry)# destination-group 100
MDS9706(conf-tm-dest)# no ip address 10.10.60.97 port 5888 protocol gRPC encoding GPB
MDS9706(conf-tm-dest)# ip address 10.10.60.97 port 5889 protocol gRPC encoding GPB
MDS9706(conf-tm-dest)# copy running-config startup-config
After changing the port on the switch, a property change is required on IO Appliance. Contact Virtana Support.
Configure compact GPB streaming with IO and Cisco NX-OS 8.3(2):
Note
With Cisco MDS NX-OS 8.3(2), Cisco switch supports Google Protocol Buffers (GPB) and GPB compact encoding over gRPC transport. Ensure that all destinations under a destination group, and all destination groups under a subscription, are using the same encoding type.
Virtana and Cisco recommend using compact-GPB encoding with IO and NX-OS 8.3(2).
Use numbers from <1-4095> for sensor-group, destination-group, subscription, snsr-grp and dst-grp
Refer to Configuring SAN Telemetry Streaming in the Cisco MDS 9000 Series SAN Analytics and SAN Telemetry Streaming Configuration Guide, Release 8.x for more information.
MDS9706# configure terminal
MDS9706(config)# telemetry
MDS9706(config-telemetry)# sensor-group 200
MDS9706(conf-tm-sensor)# path analytics:virtana_query
MDS9706(conf-tm-sensor)# destination-group 200
MDS9706(conf-tm-dest)# ip address 10.10.60.99 port 5888 protocol gRPC encoding GPB-compact
MDS9706(conf-tm-dest)# subscription 200
MDS9706(conf-tm-sub)# snsr-grp 200 sample-interval 30000
MDS9706(conf-tm-sub)# dst-grp 200
MDS9706(conf-tm-sub)# copy running-config startup-config
Choose one of the following to verify configured streaming.
Verify the configured streaming at Cisco NX-OS 8.3(1):
MDS9706# show running-config telemetry all
feature telemetry
telemetry
sensor-group 100
path analytics:virtana_query <-- analytics query name (step-3)
destination-group 100
ip address 10.10.60.97 port 5888 protocol gRPC encoding GPB
subscription 100
snsr-grp 100 sample-interval 30000 <-Streaming sample-interval 30000 is in milliseconds
dst-grp 100
Verify the configured streaming at Cisco NX-OS 8.3(2).
MDS9706# show running-config telemetry all
feature telemetry
telemetry
sensor-group 200
path analytics:virtana_query
destination-group 200
ip address 10.10.60.99 port 5888 protocol gRPC encoding GPB-compact
subscription 200
snsr-grp 200 sample-interval 30000
dst-grp 200
In the Discovered Telemetry Sources tab, subscribe to the ports to collect STS metrics.
To collect Cisco STS data, the Cisco edge switches (host/storage) must first be configured and discovered successfully. A configured and successfully discovered Cisco switch and its STS capable ports appear in the Discovered Telemetry Sources tab in Cisco SAN Integration. It contains information about Ports, Storage Port Name, License, and Last Observed Time. Reports and charts can be created with STS metrics by navigating to Storage > Fibre Channel > Cisco STS.
Verify the telemetry transport.
MDS9706# show telemetry transport
Session Id IP Address Port Encoding Transport Status
--------------------------------------------------------------------------------
1 10.10.60.99 5888 GPB-compact gRPC Connected
--------------------------------------------------------------------------------
Retry buffer Size: 10485760
Event Retry Messages (Bytes): 0
Timer Retry Messages (Bytes): 10399055
Total Retries sent: 179
Total Retries Dropped: 1341