Interface Utilization
The Interface Utilization report shows the average, maximum, and minimum input and output traffic rate. The report is generated in a tabular form with the calculations shown by each interface.
Report filtering

The following fields filter the results.
- Device Class
The device class associated with the interfaces to include in the report. The default is
/Devices/Network, all network devices.- Device Filter
A complete or partial name of the interfaces to include in the report. Letter case is ignored. A partial name matches all interface names that include it. You can also use a regular expression for this filter.
- Start Date / End Date
The first and last dates of the range of dates to include in the report. To select a date from a calendar, click Select. The default range is the week ending with the current date.
To generate or refresh the report, click Update. To show all interfaces on the report, select the Show All Interfaces check box before clicking Update.
Report contents
Column | Content |
|---|---|
Path | The path of the device class. |
Device | The name of the device that contains the interface, with a link to its overview page. |
Interface | The name of the interface, with a link to its overview page. |
Description | A description of the interface. |
Speed | The maximum transfer rate the interface supports, per second. |
In Avg | The average input traffic through the interface, per second. |
Out Avg | The average output traffic through the interface, per second. |
In Max | The maximum input traffic through the interface, per second. |
Out Max | The maximum output traffic through the interface, per second. |
In Min | The minimum input traffic through the interface, per second. |
Out Min | The minimum output traffic through the interface, per second. |
95% In | Projected date of exhaustion for input traffic. |
95% Out | Projected date of exhaustion for output traffic. |
Note
In order for the In Max and Out Max values to be calculated, you need to have at least 8 hours worth of data, otherwise a N/A value will be returned.
The following shows the navigation bar at the bottom of the report. To quickly navigate to other pages, select the device name from the popup list. In this example, there are 5 pages of results from device 10.171.100.107 followed by one page of results from device 10.171.100.109, and so on.
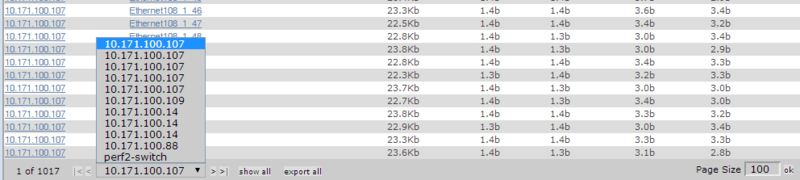
Click Export all to export the report as a CSV file.