Dynatrace CO Integration
 |
The IO Splunk AppDynamics CO, ServiceNow, and Dynatrace CO integrations all discover running applications in those products and add them to IO. IO uses the applications discovered by the first-executed function (Splunk AppDynamics CO, ServiceNow, or Dynatrace CO), and, after the other function executes, conflict resolution and manual reconciliation of differences as seen by IO might be required.
Unmonitored hosts from an application in a Dynatrace instance, continue to be shown in Infrastructure Observability. After 72 hours and with the next discovery of the Dynatrace Integration, it re-imports this application. For the host which is marked unmonitored, the Dynatrace API still returns that host, which is the same as it was before it was marked unmonitored.
If a Dynatrace Integration imports two or more applications (A and B) consisting of the same or similar nodes, when integrations such as ServiceNow, Operating System, etc. perform application discovery and provide suggestions, the integrations suggest only for one application (A), not the other similar application (B). When changes are made in Dynatrace for Application(A) and Dynatrace reimports Application(A) (with changes), the suggestions from the integrations are shown on Application(B).
Configuring Dynatrace CO Integration
IO discovers/imports applications directly from either the local or cloud instance of the Dynatrace CO controller, and creates applications only from existing Hosts, VMs, Microsoft Hyper-V VMs, and PowerVM Partitions that have been discovered by other IO integrations.
Prerequisites
You must have defined Application patterns in their Dynatrace instance to discover different applications in Dynatrace. This is a prerequisite for the Dynatrace Integration to discover the applications correctly.
You must have disabled Real User Monitoring (RUM) for monitoring with the Dynatrace Integration.
Steps
Select an instance of a Dynatrace app (cloud or on-premise) and copy the main Dynatrace URL.
From the Settings tab, click Integrations in the Probes and Integrations section, and then click the View button for Dynatrace CO.
The Dynatrace CO page is displayed.
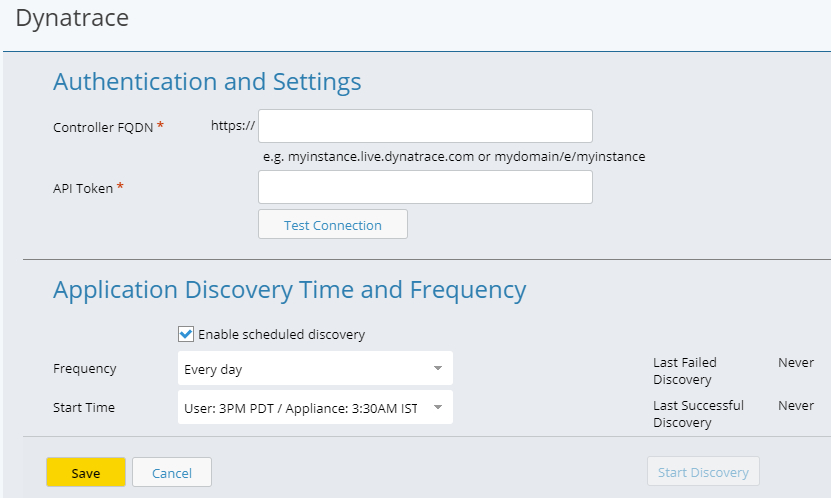
Copy and past the main Dynatrace URL into the Controller FQDN field.
Copy the API Token from Dynatrace site and paste it into API Tokenfield.
For additional information, see https://www.dynatrace.com.
Click Test Connection to verify that the specified URL and API Token can connect to the Dynatrace site successfully.
Click Save and then Start Discovery.
You can click Save at any time to save the current status of the operation.
The specified Dynatrace application is discovered. If scheduled discovery was specified (defaults to Enable), it begins as specified in the Discovery Time and Frequency section.
After you create an application, you can drill down into it to see topology, application components, and FC conversations.