On-Premises Compute Cost and Capacity
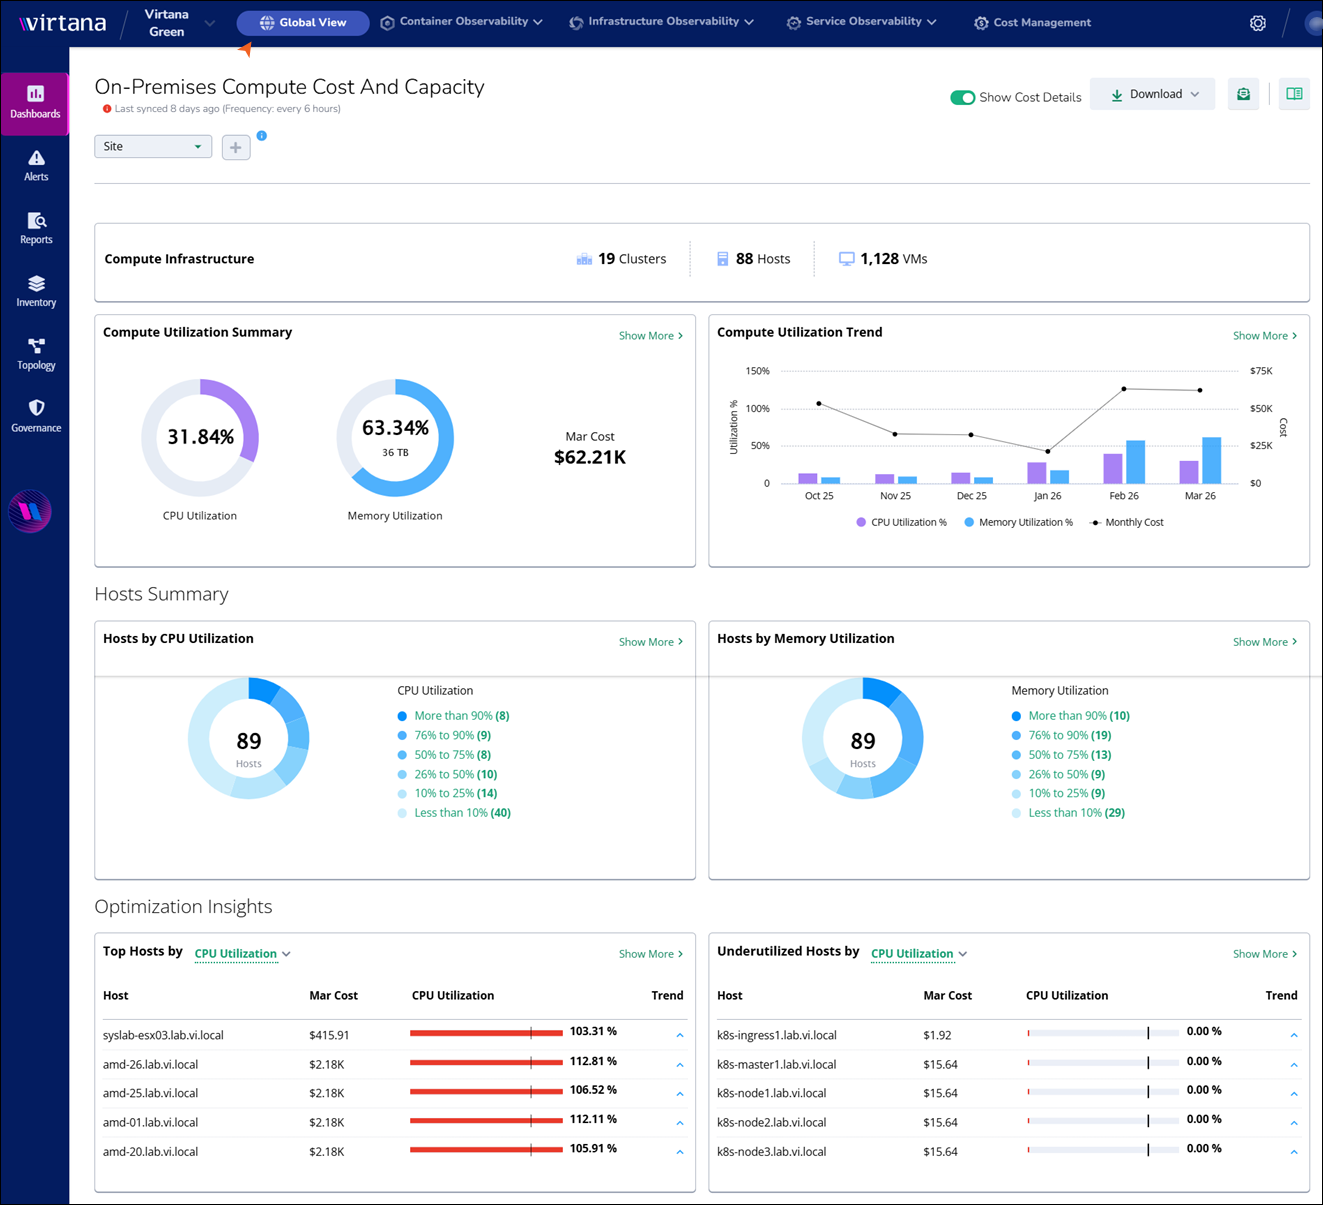
The On-Premises Compute Cost and Capacity dashboard offers a clear, consolidated view of your on-premises compute environment, highlighting both resource usage and associated costs in one place. It provides quick visibility into the number of clusters, hosts, and virtual machines currently running, along with insights into CPU and memory utilization levels. The dashboard tracks trends over time, giving a valuable perspective on utilization patterns and monthly compute cost changes, enabling more informed and strategic capacity planning decisions.
Opening the On-Premises Compute Cost and Capacity dashboard
Log in to the Virtana Platform and navigate to the Global View.
Click Dashboards and select the On-Premises Compute Cost and Capacity option.
Working with sync data and frequency
Virtana Cloud Sync (VCS) on your appliance collects and sends entity and metric data to Virtana Platform. Each data domain (such as compute or storage) is governed by a collection policy that defines how often data is synced.
The dashboard shows:
Last Updated on time: When Global View last received valid data.
Sync frequency: The expected interval between successful syncs.
Policy | Default frequency | Default page to visit |
|---|---|---|
LLM Token | Every 6 hours | Global View > Dashboards > Token Usage Dashboard |
Compute Host | Every 6 hours | Global View > Dashboards > On-Premises Compute Cost And Capacity |
Storage Arrays | Every 24 hours | Global View > Dashboards > On-Premises Storage Array Cost And Capacity Summary |
GPU Fleet | Every 6 hours | Global View > Dashboards > GPU Fleet Analysis |
License | Every 24 hours | Settings > License Usage |
Compute Infrastructure
Clusters: View the total number of clusters in your environment.
Hosts: Displays the total number of hosts in your infrastructure.
Virtual Machines (VMs): Shows the total number of VMs in your infrastructure.
Compute Utilization Summary
The Compute Utilization Summary section provides a high-level overview of the current resource utilization in your environment. This includes both CPU and memory usage across all monitored hosts and virtual machines.
Current CPU Utilization: Displays the current percentage of CPU resources being used across all clusters and hosts.
Current Memory Utilization: Shows the current percentage of memory being used.
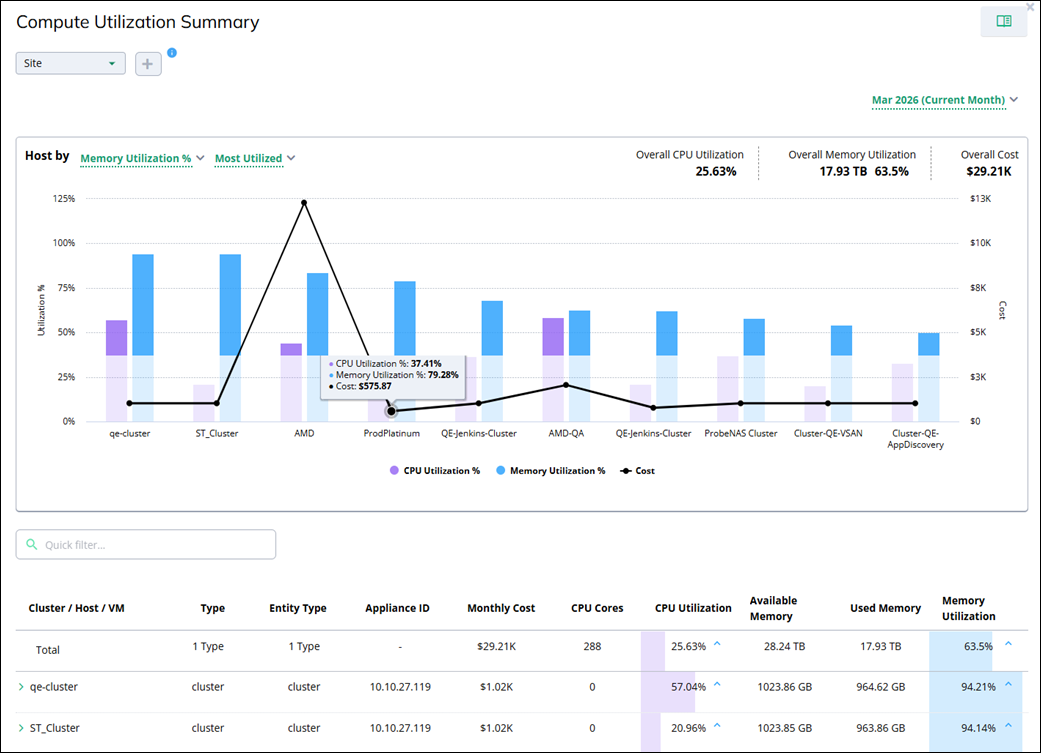
Compute Utilization Summary Side Panel
The Compute Utilization Summary Side Panel provides a comprehensive set of filter options and displays summarized data to help you analyze and manage your infrastructure more effectively. Here’s a detailed look at its features and functionalities:
Filters and grouping
The side panel allows you to refine the displayed data using various filter options:
Site filter: It is a default filter you can use to choose specific sites to focus on data relevant to a particular location or data center.
Add filter: To add more filter options, click +. You can select multiple filter options from a drop-down. The selected options are applied as additional filters for the data shown in the chart and table.
Note
You can select up to 10 options in each filter. Once the limit is reached, further selections are disabled.
Time range filter: On the top right of the panel, you can view the current reporting month, such as Mar 2026 (Current Month). You can select a different month to view specific data. This helps in understanding historical trends and comparing month-over-month performance.
You can also access Host by options in the chart for:
Memory Utilization: Filter clusters based on their memory usage. This can help pinpoint clusters that are consuming excessive memory.
CPU Utilization: Similarly, filter clusters by their CPU utilization to identify those that are under heavy computational load.
Most Utilized to Least Utilized: Sort clusters from the most utilized to the least utilized based on memory or CPU usage. This filter helps in identifying heavily loaded clusters that might need additional resources or optimization.
Summary overview
The side panel includes a monthly summary view, allowing you to view:
Overall CPU Utilization: View a graphical representation of CPU utilization for the selected month. This graph provides insights into the percentage of CPU usage over time.
Overall Memory Utilization: A comparative graph showing memory utilization percentages side-by-side, helping you to identify imbalances or potential bottlenecks quickly.
Overall cost: You can also view the monthly cost for the selected scope.
This view allows quick comparison of utilization and cost across sites, clusters, or other selected dimensions to identify under‑utilized or high‑cost entities.
Detailed data view
Based on the applied filters, you can view detailed data on various aspects of your infrastructure, including:
Column name | Description |
|---|---|
Cluster/Host/VM | The Total row provides an aggregate over all displayed entities. Individual entities, such as qe-cluster, can be expanded or collapsed using the chevron icon. |
Type | The type of entity displays the hierarchy role of Cluster/Host/VM in this dashboard, for example, a cluster. |
Entity Type | Monitored entity category or canonical classification used across the platform, for example, cluster. |
Appliance ID | Identifier or IP address of the appliance monitoring the entity. |
Monthly Cost | Total monthly cost computed for a particular Cluster/Host/VM. |
CPU Cores | The number of CPU cores available for the entity. |
CPU Utilization | The percentage of CPU resources currently in use. |
Available Memory | The total memory available within the particular Cluster/Host/VM in the same row. |
Used Memory | The amount of memory currently being utilized. |
Memory Utilization | Percentage of used memory relative to available memory |
Using the Compute Utilization Summary Side Panel
Select the desired site and click + to refine the data displayed.
Use the month filter to select the month you want to analyze.
Analyze the CPU, memory utilization, and computed cost graphs to get an overview of resource usage.
Use the filters to sort clusters by their memory or CPU utilization, identifying areas that may need optimization or additional resources.
Review the detailed data on host and VM counts, CPU cores, CPU utilization, available and used memory, and memory utilization to get a comprehensive view of your infrastructure's performance.
Compute Utilization Trend
The Compute Utilization Trend section provides a more detailed and dynamic view of resource usage trends over time.
Percentage Utilization Range: The percentage scale ranges from 0% to 150%, providing a clear view of resource usage beyond typical capacity.
Host Count: Displays the number of hosts being monitored and their respective utilization statuses.
CPU Utilization Trend: A trend graph showing CPU usage over a selected time period, helping to identify peak usage times and potential bottlenecks.
Memory Utilization Trend: A trend graph illustrating memory usage patterns, useful for understanding memory demand and planning for upgrades or optimizations.
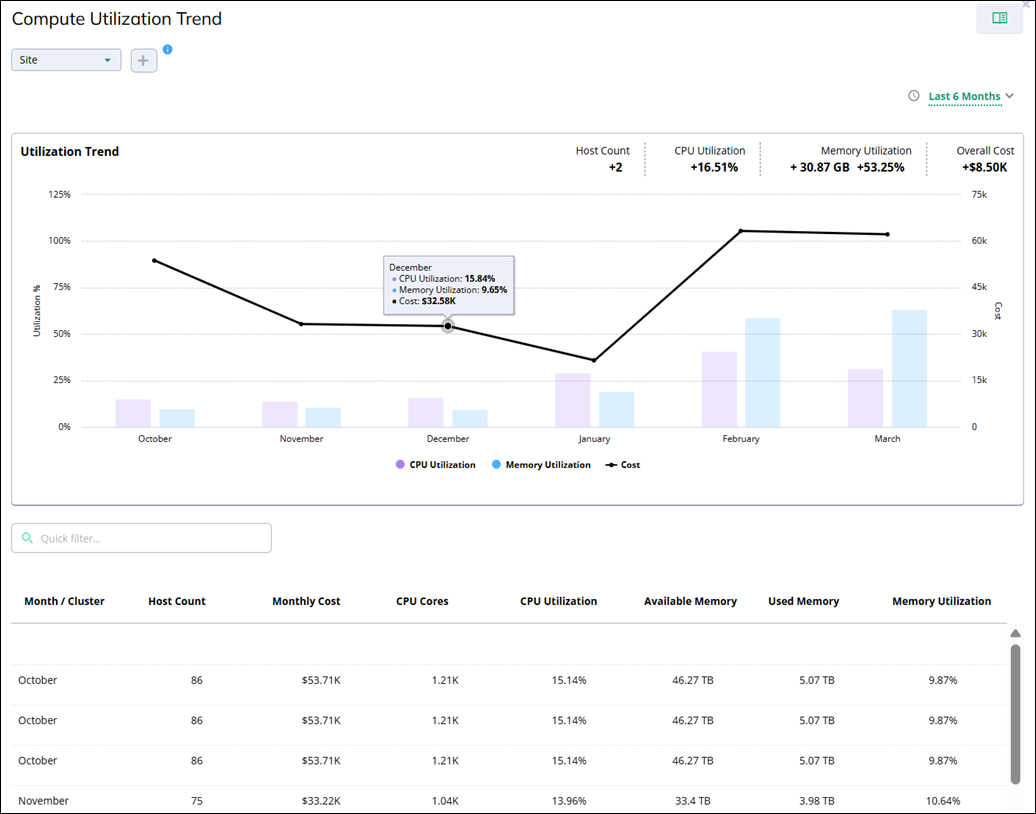
Compute Utilization Trend Side Panel
The Compute Utilization Trend side panel provides a comprehensive view of utilization trends across different time periods, enabling detailed analysis and planning.
Filters and grouping
The side panel allows you to refine the displayed data using various filter options:
Site filter: It is a default filter you can use to choose specific sites to focus on data relevant to a particular location or data center.
Add filter: To add more filter options, click +. You can select multiple filter options from a drop-down. The selected options are applied as additional filters for the data shown in the chart and table.
Note
You can select up to 10 options in each filter. Once the limit is reached, further selections are disabled.
Time range filter: On the top right of the panel, you can select a time range (such as last 3, 6, 9, or 12 months) to view the compute utilization trend of a specific time range. This helps in understanding historical trends and comparing month-over-month performance.
Utilization trend chart
The panel displays a combined bar and line chart labeled Utilization Trend. You can view the following details:
Host Count: Total monitored host count over the period.
CPU Utilization: Percentage change in average CPU utilization.
Memory Utilization: Percentage change in used memory and utilization.
Overall Cost: Total computed cost of the selected period.
Each month’s bar and point combination represents the average CPU utilization, average memory utilization, and total cost for that period. Hovering over a data point opens a tooltip with the month‑level details.
Detailed data view
Detailed Data Based on Applied Filters:
Column name | Description |
|---|---|
Month/Cluster | The time label is combined with the grouping level. |
Host Count | Total number of monitored hosts for that period. |
Monthly Cost | Total monthly cost for that period. |
CPU Cores | Total CPU cores available during that period. |
CPU Utilization | Average CPU utilization for the selected month. |
Available Memory | Total available memory capacity. |
Used Memory | Amount of memory currently being utilized. |
Memory Utilization | Percentage of used memory. |
Host Utilization
The Host Utilization section provides an overview of the top-performing hosts based on CPU and memory utilization.
Top Hosts by CPU Utilization: Displays the hosts with the highest CPU usage, showing details such as the host name, CPU utilization percentage, and utilization trend over time.
Top Hosts by Memory Utilization: Highlights the hosts with the highest memory usage, including details on memory utilization percentage and trend data.
Show More: Click Show More to expand the view to reveal additional Compute Utilization details, offering a deeper dive into the resource consumption patterns of your hosts. See
Optimization Insights
The Optimization Insights section provides a snapshot of how your compute resources are being utilized, focusing on identifying underutilized assets.
Underutilized Hosts By CPU: Displays hosts that are currently underutilized in terms of CPU usage, helping you identify potential areas for optimization.
Underutilized Hosts By Memory: Shows hosts with low memory utilization, allowing you to pinpoint opportunities to consolidate workloads or reallocate resources.
Show More: Click Show More to expand the view to include detailed Compute Utilization data, giving you a comprehensive look at how resources are being consumed across your infrastructure.
Troubleshooting Dashboards in Global View
This topic is intended as a first step in either diagnosing the problem yourself or asking for help. View the following information to resolve common issues with sync frequency and stale data on the Virtana On-Premises Compute Cost and Capacity dashboard. If the data appears outdated, the issue may be caused by one of the following:
Error: “Last synced … ago” shows a date that is too old
View the following information to resolve common issues with sync frequency and stale data on the impacted dashboard, for example, the Virtana On-Premises Compute Cost and Capacity dashboard. If the data appears outdated, use the following steps to identify and address the issue:
What you see
The dashboard shows that the last successful synchronization occurred 8 days ago, despite a scheduled frequency of every 6 hours. This means the "Last Updated" timestamp is significantly older than expected. Additionally, the system may show alerts regarding missed sync windows or failed synchronization attempts.
Why it happens
Possible reasons this error occurs include:
The scheduled sync job did not run or failed repeatedly.
VCS is not sending new data according to the expected schedule.
The upstream service is running, but is failing to send data to the cloud ingestion process in Global View.
How to fix
If dashboard data is not displaying as expected, try the following options:
Option A: Verify synchronization
Check the Sync window: Note the dashboard’s Frequency.
Wait for cycle completion: Compare the Frequency with the current time, for example, for a 6-hour frequency, wait 1–2 cycles.
Refresh and check: Refresh the browser and check again.
Option B: Adjust filters
Clear or widen existing filters to see if the clusters, hosts, or VM counts populate.
Option C: Contact Virtana Support if the issue persists
The resolution may require fixing VCS data transmission or correcting data processing issues in Global View to restore normal operation.
Error: Costs missing or incorrect
What you see
The utilization panel shows a monthly cost as zero or inconsistent.
Why it happens
Cost display depends on the cost configuration.
Stale sync can cause cost data to lag even if utilization is visible.
How to fix
Option A: Initial synchronization cleanup
Resolve stale sync issues first and re-check costs after the next refresh.
Option B: Status verification and monitoring
Confirm that the relevant cost meter card is active. Allow time for the next scheduled refresh.
Option C: Contact Virtana Support
If the dashboard is up to date but costs are still missing or clearly wrong, contact Virtana support. Share the information, such as a screenshot of the affected cost panel, tenant/org, and last synced frequency from the header.