 Device Status tile
The Device Status tile provides an at-a-glance honeycomb visualization of device up/down status directly within a dashboard. Each device appears as a color-coded hexagon, making it easy to spot down devices without needing separate queries.
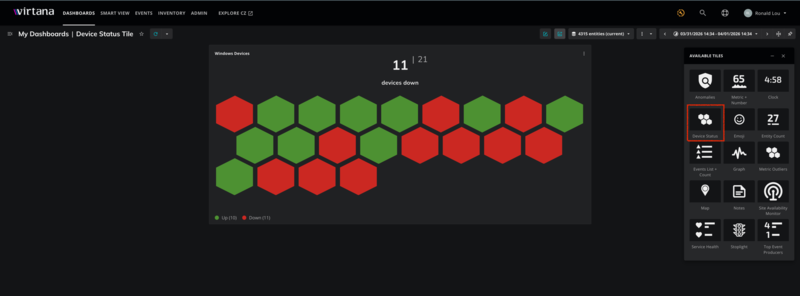
Green = UP
Red = DOWN
A device is classified as DOWN if it has an open CRITICAL or ERROR event in the /Status/Ping event class; otherwise it is UP. The tile displays a count in the format 11 | 21 with a configurable subtitle below, for example, devices down. Hovering over a hexagon displays the device name and its organizer path.
Note
The tile appears as Device Status in the Available Tiles panel.
To add and configure a Device Status tile follow the steps below:
In Dashboards, open or create a dashboard, and then click the Add Tile icon.
In the Available Tiles panel, click Device Status.
In the Tile title field, enter a title for the tile.
In the Subtitle field, enter a subtitle. The subtitle appears below the device count on the tile.
(Optional) Under Tile scope filters, create a filter to limit the devices displayed in the tile:
Click + to add a clause.
Click in the first field to select an entity field.
Select your operator, then select your value.
To add or remove clauses, use the buttons in the query.
Click Save.
After adding the tile, you can use the three-dot menu (⋮) to export the tile data or view the tile in fullscreen mode.
Note
The tile handles up to 9,999 scoped devices. If the dataset exceeds this limit, the following warning banner displays at the top of the dashboard:
Showing first 9,999 of X devices. Refine your scope to view specific devices.
If the dashboard scope contains no devices, the tile displays No entities in scope.