Microsoft Hyper-V Integration
 |
The Microsoft Hyper-V Integration is an agentless solution that discovers the Microsoft® Hyper-V environment and provides VM-to-disk LUN visibility.
Advanced analytics enable IT managers to optimize the performance, utilization, and health of their virtualized IT infrastructure running on Hyper-V. This integration offers the ability to correlate Hyper-V CPU and disk metrics with system-wide infrastructure metrics to improve overall application performance. It also enables insight into SAN/NAS I/O intelligence and operational visibility to Hyper-V deployments, which in turn enables administrators to achieve higher performance and better balanced virtual machine deployment based on real-time measurement and analysis of I/O performance.
Supported versions include Windows Server 2012 (R2)/Hyper‐V Server 2012 (R2), Windows Server 2016/Hyper-V Server 2016, Windows Server 2019/Hyper-V Server 2019, and Windows Server 2022 / Hyper-V Server 2022.
Hyper-V Entities
Entity Type | Properties |
|---|---|
HyperV-VHD | VHD Type |
Prepare the Windows environment for monitoring
A supported version of Hyper-V/Windows Server is installed and configured. For more information, see the Interoperability section.
Windows Remote Management (WinRM) is configured.
The Windows hosts are configured for monitoring. For more information, see Configuring the Windows hosts for monitoring.
For access to the Windows host, note the following:
A WinRM user and login credentials for the OS host are available.
The user is a member of the Hyper-V Administrators or Administrators group.
An appropriate port is available. If using WinRM over HTTPS, use port 5986. If using WinRM over HTTP, use port 5985.
The supported transport method for host credentials is NTLM.
Before configuring the Microsoft Hyper-V integration, prepare the Windows environment for access by the integration. Complete the following tasks on each Windows host server. You can complete the tasks in any order, but all tasks must be complete before configuring the Hyper-V integration in IO (Infrastructure Observability) for discovery.
Create a domain user service account.
Add the domain user service account to the Performance Monitor Users group.
Configure Windows Management Instrumentation (WMI).
Configure Windows Remote Management (WinRM).
Configure the Windows Firewall.
Optional:
Create the HTTPS (WinRM) certificate.
Download (export) the HTTPS certificate.
You must create a domain user that IO can use to access Windows and gather monitoring data.
Prerequisites
You are running a supported version of 64-bit Windows Server: 2012, 2012 R2, 2016, 2019 or 2022. If you are running an earlier version, contact Virtana Support.
You are logged in as a domain administrator.
You have the IP address and subnet for IO.
Note
The instructions in this section describe one way to configure a Windows Server for connectivity with IO. If these instructions do not work for your Windows Server configuration, contact Microsoft Support for assistance.
Create a Domain User Service Account in Active Directory
Enter a password and configure the following password options:
Clear the User must change password at next logon checkbox.
Select the User cannot change password checkbox.
Select the Password never expires checkbox.
Click Next and then click Finish.
Complete these steps on each server that IO monitors.
Log in as a domain administrator.
Navigate to Administrative Tools and open Computer Management.
Navigate to Local Users and Groups and select Groups.
Double-click Performance Monitor Users and add the domain user service account you created in the previous task.
Click Apply and then click OK to close the properties page.
Windows Management Instrumentation (WMI) Configuration
Configure the domain user service account in WMI so it can access the Windows host and gather monitoring data. You must be logged in as a domain administrator to complete this task.
Open Windows PowerShell and run the following command:
Alternatively, navigate to Control Panel > Administrative Tools > Computer Management > More Actions > WMI Control.
In the right pane under Actions / WMI Control, click More Actions to open the WMI Control Properties wizard.
Click the Security tab and select Root.
Click Security. In the Group or user names field, select the domain user service account you created. If the account is not listed, click Add, enter the username, and click OK.
Select the domain user service account and select the following permissions:
Execute Methods
Provider Write
Remote Enable
Click Advanced, select the domain user service account, and then click Edit.
Set Applies to to This namespace and subnamespaces.
Applies to = This namespace and subnamespaces
Confirm that the following permissions are selected: Execute Methods, Provider Write, and Remote Enable.
Click Apply and then click OK to close all open dialog boxes.
WMI configuration is complete.
Windows Remote Management (WinRM) Configuration
Configure the same domain user service account in WinRM that you configured in WMI.
Open Windows PowerShell and run the following command:
Enable-PSRemoting
Open PowerShell and run the following command:
Alternatively, navigate to Control Panel > Administrative Tools > Computer Management > More Actions > WMI Control.
The Permissions for Default window opens.
Select the domain user service account and select the following permissions:
Read (Get, Enumerate, and Subscribe)
Execute (Invoke)
If the domain user is not listed, click Add, enter the username, and click OK.
Click Apply and then click OK to close the window.
WinRM configuration is complete.
Configure the Windows Firewall
If a firewall is enabled, configure a firewall exception to allow communication between the IO Appliance and the Windows server.
Open PowerShell and run the following command:
In the left pane, click Inbound Rules. In the right pane, click New Rule.
The New Inbound Rules wizard opens to the Rule Type tab.
Configure the wizard tabs as follows. Click Next to move between tabs.
Note
Virtana recommends defining firewall connection rules by remote IP address rather than limiting local and remote ports or local IP addresses. Set the remote IP address to the IP address of the IO Appliance.
Clicking Next moves you through the wizard tabs, identified in the left pane.
On the Rule Type tab: Select Custom and click Next.
On the Program tab: Confirm that All programs is selected and click Next.
On the Protocol and Ports tab: Leave the defaults and click Next.
On the Scope tab:
In the Which remote IP addresses does this rule apply to field, select These IP addresses and click Add.
In the This IP address or subnet field, enter the IP address of the IO Appliance and click Next.
On the Action tab: Confirm that Allow the connection is selected and click Next.
On the Profile tab: Confirm that Domain is selected. Clear Private and Public if required, and then click Next.
On the Name tab: Enter a name and description for the firewall rule and click Finish.
Restart the required services:
Open Services by running the following PowerShell command: services.msc
Select the Windows Management Instrumentation service and restart it.
Restarting Windows Management Instrumentation also restarts the User Access Logging and IP Helper services.
Click Yes in the confirmation dialog to restart the three services.
Windows Firewall configuration is complete.
Configure the Microsoft Hyper-V integration
Use this procedure to configure the Microsoft Hyper-V integration in IO (Infrastructure Observability). Before you begin, ensure you have completed all tasks in Prepare the Windows environment for monitoring.
On the Settings screen, click Integrations in the Probes and Integrations section.
The Integrations screen opens.
Click View for the Microsoft Hyper-V software integration.
The Microsoft Hyper-V screen opens.
For a description of the columns on this screen, see Microsoft Hyper-V inventory columns below.
At the end of each row, click the down arrow to access shortcuts to Configure, Test Connection, Start Discovery, or Delete the integration in that row.
Click New.
The Discover New Integration screen opens.
In the Name field, enter a name for the integration.
The Name field is user-configurable. The Type, Frequency, and Time of Day fields are carried forward from the Integration Inventory page.
Configure scheduled discovery:
To keep regularly scheduled discovery enabled (recommended), confirm that the Enable scheduled discovery checkbox is selected, then select a discovery frequency and time of day. The default is every day at 2:00 AM appliance time.
To disable regularly scheduled discovery, clear the Enable scheduled discovery checkbox.
Add Hyper-V hosts using one of the following methods:
Add one host at a time: Click Add and continue with the next step.
Import multiple hosts from a CSV file: Click Import and skip to the Import multiple Hyper-V hosts step below.
In the Add Host dialog, complete the following fields and click OK:
Field
Description
Name
User-defined name for the integration, typically the hostname. For example, HYPERV-SC01.
Hostname
IP address or fully qualified, DNS-resolvable hostname of the Hyper-V host. For example, hyperv-sc01.lab.company.local.
Domain
Domain of the user account used to poll data from the host.
Username
User account used to poll data from the host.
Password
Password for the user account.
Metrics Polling Interval
Frequency of metrics collection. The default is every 5 minutes.
The host appears in the Hosts list on the Discover New Integration screen. Skip the next step and continue with Configure and subscribe hosts.
Import multiple Hyper-V hosts
Before clicking Import, prepare a CSV configuration file. The file must contain one line per host with no header row. Each line must use the following format:
Name, Hostname/IP Address, AD Domain, Username, Password, Polling Interval
Example:
hyperv-host-01,10.10.56.12,hyperv.dev,vi-services,samplepassword,5min
hyperv-host-02,10.10.56.13,hyperv.dev,vi-services,samplepassword,10min
The following table describes each field in the CSV file:
Field
Description
Name
Display name for the host.
Hostname/IP Address
IP address or fully qualified, DNS-resolvable hostname of the Hyper-V host. For example, hyperv-sc01.lab.company.local.
AD Domain
Active Directory (AD) domain of the user account used to poll data from the host.
Username
User account used to poll data from the host.
Password
Password for the user account.
Polling Interval
Frequency at which the host is polled. Accepted values: 1min, 5min, 10min, 15min, 1hour.
When your CSV file is ready, click Import.
In the Import dialog, select one of the following import modes:
Replace: Removes all existing records and adds all records from the CSV file.
Merge: Updates existing records with values from the CSV file. Blank fields in the CSV file are ignored. New records from the file are added.
Add: Leaves existing records unchanged and adds only new records from the CSV file.
Click Save to apply the import.
Configure and subscribe hosts
To update settings for multiple hosts at once, select the hosts from the Hosts list and click Configure.
Select the fields you want to change and click Next.
Enter the updated values in the Bulk Configuration dialog.
Click OK to apply the changes.
Optionally, click Test Connection to verify the hostname and credentials for all Hyper-V hosts.
This process can take up to five minutes. A message appears indicating whether the configuration is correct or if there are errors to correct.
In the Hosts list, select the hosts you want to subscribe to and click Subscribe.
When you click Subscribe, IO also validates that sufficient licenses are available.
Click Save to save your changes.
The Discover dialog opens, asking whether you want discovery to start immediately. Virtana recommends starting discovery immediately, as no metrics are collected until discovery is complete.
Click Yes to start discovery immediately.
You return to the main integrations grid. The integration you added shows Discovering... in the Last Discovery column.
While discovery is in progress, the integration is in read-only mode. You cannot make changes to the integration or host configuration until discovery is complete.
Microsoft Hyper-V inventory columns
The following table describes the columns on the Microsoft Hyper-V inventory screen.
Column | Description |
|---|---|
Name | User-defined name for the integration, typically the integration IP address or type of integration. For example, Brocade_BNA_27 or seed_switch_1. |
Subscription | Subscription status: Unsubscribed or Subscribed. For Cisco SAN and Brocade SAN integrations, if subscribed, shows a ratio of subscribed switches to total configured switches. For example, 1/5 means one of five configured switches is subscribed. |
Last Discovery | Date and time of the last discovery run. Other possible values are: Discovering (discovery in progress), No discovery, Discovery failed, or Warned. For Discovery failed or Warned status, hover over the cell to see the error or warning as a tooltip. |
Last Metrics Collection | Date and time of the last metrics collection. Other possible values are:
If an integration fails to collect metrics for two hours, you receive a Health Notification alert and an email notification. |
Add a VMM
Use this procedure to add a Virtual Machine Manager (VMM) to the Microsoft Hyper-V integration. A VMM lets IO discover and manage the Hyper-V hosts under its control through a single connection, instead of adding each host separately.
On the Microsoft Hyper-V screen, click the VMM tab.
Click Add.
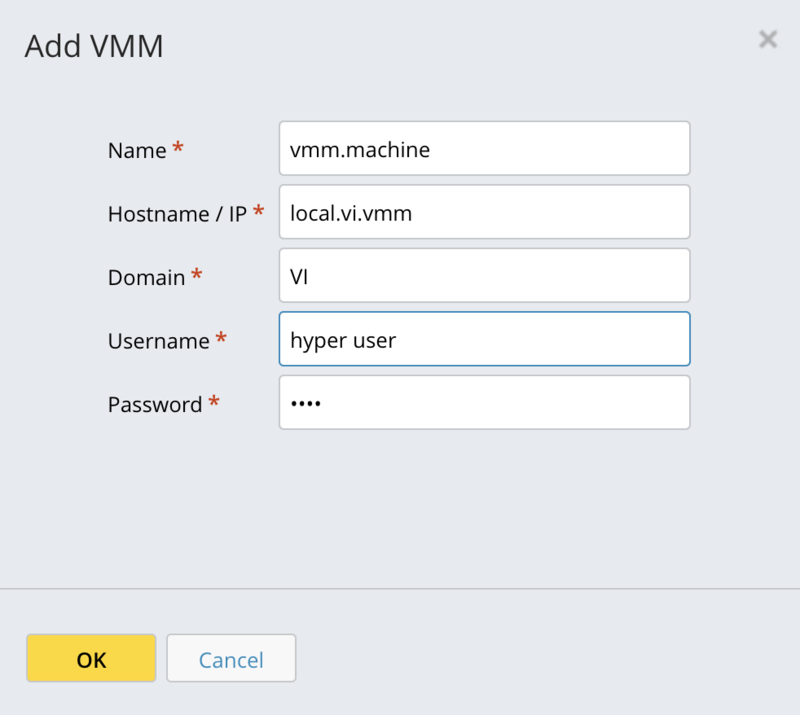
The Add VMM dialog opens.
Complete the following fields and click OK:
Field
Description
Name
User-defined name for the VMM.
Hostname / IP
IP address or fully qualified, DNS-resolvable hostname of the VMM.
Domain
Domain of the user account used to connect to the VMM.
Username
User account used to connect to the VMM.
Password
Password for the user account.
The VMM appears in the VMM list with its name, hostname, and AD domain.
Import VMM configurations
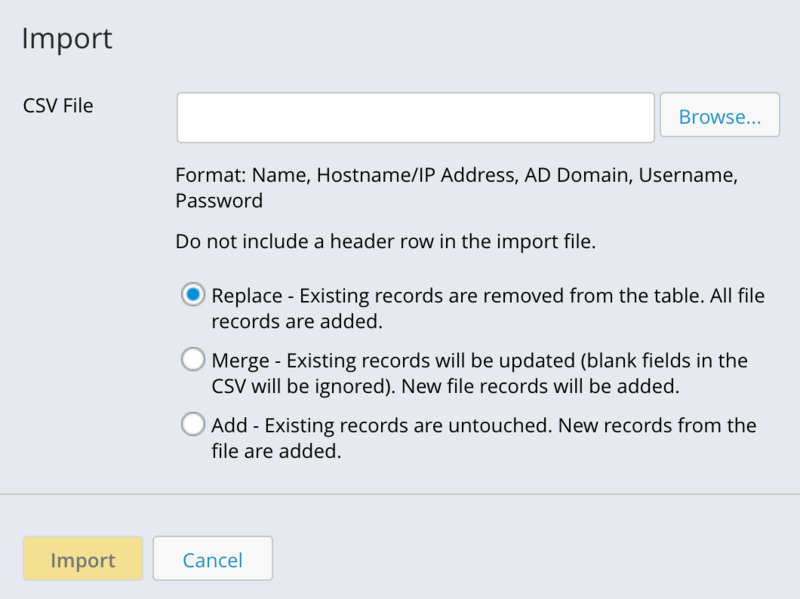
Use this procedure to import multiple VMM configurations at once from a CSV file, instead of adding each VMM individually.
Before clicking Import, prepare a CSV configuration file. The file must contain one line per VMM with no header row. Each line must use the following format:
Name, Hostname/IP Address, AD Domain, Username, Password
Example:
hyperv-vmm-01,10.10.56.20,hyperv.dev,vi-services,samplepassword
hyperv-vmm-02,10.10.56.21,hyperv.dev,vi-services,samplepassword
On the Microsoft Hyper-V screen, click the VMM tab.
Click Import.
The Import dialog opens.
Next to the CSV File field, click Browse and select the CSV file.
Select one of the following import modes:
Replace: Removes all existing records from the table and adds all records from the CSV file.
Merge: Updates existing records with values from the CSV file. Blank fields in the CSV file are ignored. New records from the file are added.
Add: Leaves existing records unchanged and adds only new records from the CSV file.
Click Import.
The imported VMM configurations appear in the VMM list.
Configure a VMM
Use this procedure to update the connection details for an existing VMM configuration.
On the Microsoft Hyper-V screen, click the VMM tab.
Select the checkbox next to the VMM you want to configure.
Click Configure.
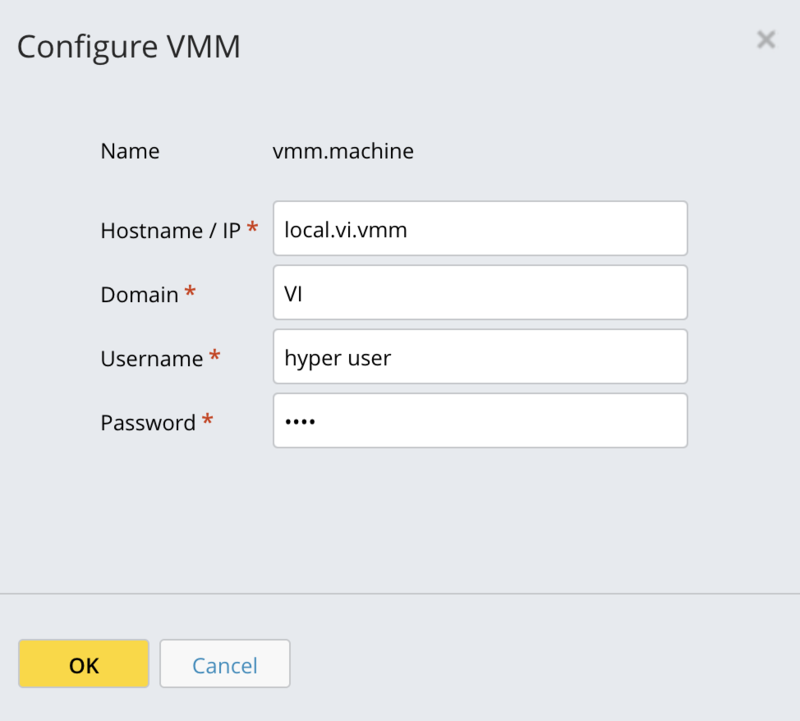
The Configure VMM dialog opens. The Name field is read-only. To rename a VMM, delete the configuration and add it again with the new name.
Update the Hostname / IP, Domain, Username, or Password field as needed.
Click OK.
The updated connection details are saved for the VMM.
Discover hosts from a VMM
Use this procedure to discover the virtualization hosts that a VMM manages.
On the Microsoft Hyper-V screen, click the VMM tab.
Select the checkbox next to the VMM you want to discover hosts from.
Click Discover host.
A confirmation message states the number of new hosts added and existing hosts updated from the VMM. Newly discovered hosts are in a configured state. Click the Hosts tab and subscribe to each host to enable individual host discovery and metric collection.
Delete a VMM configuration
Use this procedure to remove a VMM configuration that you no longer need.
On the Microsoft Hyper-V screen, click the VMM tab.
Select the checkbox next to the VMM configuration or configurations you want to delete.
Click Delete.
In the confirmation dialog, click OK.
Warning
Deleting a VMM configuration removes it permanently and stops discovery of its associated hosts.
The deleted VMM configuration no longer appears in the VMM list.