Root cause analysis for alerts
Global View presents the platform’s root cause analysis (RCA) for an alert on the Troubleshooting tab of the alert page. The analysis depends on the alert and on how it is started. Some alerts carry a built-in analysis that runs as soon as the alert is raised, and any alert can be investigated by an agentic RCA investigation that you start from Copilot or that a policy starts for you.
Tracepath RCA alerts
A tracepath RCA alert tells you that a traced transaction path in your environment has breached its response-time service-level objective (SLO), and it identifies the underlying cause automatically. Virtana CO detects the breach at the trace path level, runs a multi-layer root cause analysis, and surfaces the result in the Global View Alerts list, so you can triage the slowdown without switching between separate application, Kubernetes, and infrastructure dashboards. See traces for detailed tracepath information.
A tracepath RCA alert differs from a threshold or single-metric alert because it correlates data across application traces, Kubernetes infrastructure, pod and node metrics, logs, and events, and then presents the findings in one consolidated view. The alert connects what you see in the app to what is happening in the underlying infrastructure, so you can tell whether the slowdown comes from application code, a noisy neighbor on the same node, resource pressure on a pod or node, or an external dependency.
About tracepath
A tracepath is Virtana's representation of a repeated transaction flow through your services. Understanding how Virtana builds a tracepath helps you interpret a tracepath RCA alert, because the alert is raised against the tracepath rather than against a single request.
Your application exposes traces as a request moves between services. A trace collector gathers the individual spans from every service involved in the request and uses a shared trace token to assemble them into one complete trace, which represents a single transaction. When the same request runs again, it creates a new transaction that follows the same sequence of services. Virtana groups these repeated transactions into a tracepath, the reusable representation of that flow. A tracepath is made up of trace services (each service the request passes through, such as web-server or db-service), and each trace service contains one or more trace operations (the endpoints or internal calls it runs, such as POST /api/traffic-6).
A standard tracepath alert notifies you when a trace path breaches its response-time SLO. Virtana CO computes the SLO threshold dynamically from the tracepath's past observations, so the alert fires when the current response time is significantly higher than the historical baseline. A tracepath RCA alert is this same SLO-breach alert with an automated root cause analysis attached. The tracepath is slow, and it identifies which trace service, operation, pod, node, log condition, or external dependency is responsible.
Identify a tracepath RCA alert in the Alerts list
Tracepath RCA alerts appear in the Global View Alerts list alongside your other alerts. Because these alerts originate in Virtana CO, they show a source type of CO and an entity type of tracepath. To find them, filter the list by the tracePath entity type.
Each tracepath RCA alert uses a description in the following form, where the entity name is the name of the tracepath that breached its SLO:
SLO: TracePath <cluster>@<namespace>^<service>#<method> <path>: Response time SLO breach detected based on past observations.
Virtana derives the tracepath name from the root span of the path, which is the first service and operation that the transaction passes through. The cluster, namespace, service, method, and route operation in the name therefore identify where the traced transaction enters your environment, not the service that caused the slowdown. To find the service and operation responsible for the breach, use the root cause analysis on the Troubleshooting tab.
For example, the following description identifies an SLO breach on the tracepath that starts at the web-server service with the POST /api/test-1-k8sissue route operation in the co-dev-02 cluster:
SLO: TracePath co-dev-02@test1^web-server#POST /api/test-1-k8sissue: Response time SLO breach detected based on past observations.
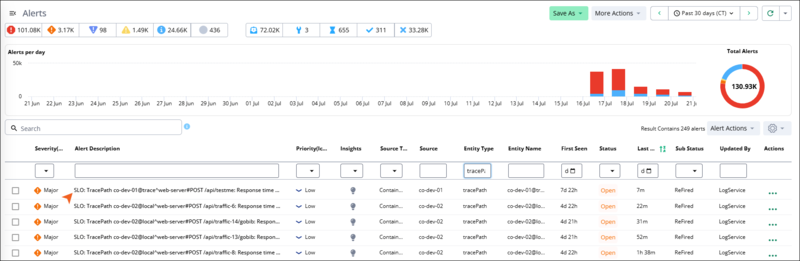 |
The Alerts list is filtered by the tracepath entity type, showing several tracepath SLO-breach alerts with their severity, priority, source, entity name, status, and sub-status.
Investigate a tracepath RCA alert
When you select a tracepath RCA alert in the alerts list, the alert detail page opens. The page contains three tabs: Overview, Troubleshooting, and Properties. Together, they provide a summary of the issue, root cause analysis, and alert metadata.
Overview tab
The overview tab summarizes the slowdown and the affected tracepath. The top of the tab presents a set of panels, and the lower half provides metric and topology sub-tabs for the same tracepath.
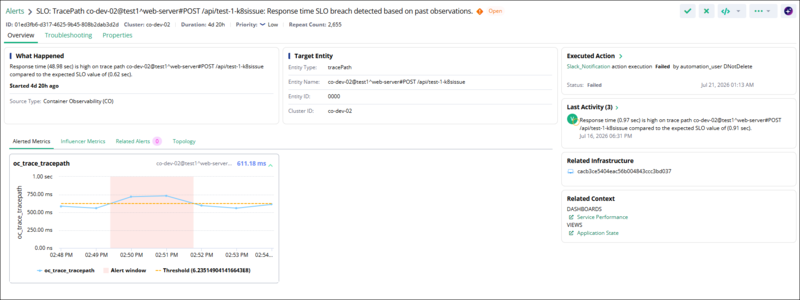 |
The Overview tab shows the What Happened, Target Entity, Executed Action, Last Activity, Related Infrastructure, and Related Context panels, with an Alerted Metrics chart plotting tracepath latency against the threshold during the alert window.
The panels at the top of the overview tab describe what happened and which entity is affected.
Panel | Description |
|---|---|
What Happened | The detected anomaly, stated as the measured response time compared with the expected SLO value, how long ago the breach started, and the source type (Container Observability). |
Target Entity | The affected trace path: the entity type ( |
Executed Action | Any automated action triggered by the alert, such as a Slack notification, with the action's execution status, the automation user that ran it, and the timestamp. |
Last Activity | The most recent activity entries for the alert, such as later SLO-breach occurrences, each with the measured and expected response times and a timestamp. |
Related Infrastructure | The infrastructure entity associated with the affected trace path, such as the pod that backs the terminal service. |
Related Context | Quick links for further investigation, including the Service Performance dashboard and the Application State view. |
Below the panels, the Overview tab provides four sub-tabs for the alerted tracepath.
Sub-tab | Description |
|---|---|
Alerted Metrics | The tracepath latency metric ( |
Influencer Metrics | Related metrics that influenced the breach, to help you correlate the latency with other measurements. |
Related Alerts | Other alerts related to the same trace path, with a count shown on the sub-tab. |
Topology | The service-to-service flow of the tracepath, from the entry service to the terminal service, so you can see the path the request follows. |
Troubleshooting tab
The troubleshooting tab presents the root cause analysis for the alert. It has two parts: a Root Cause Analysis Summary and an interactive Root Cause Analysis diagram.
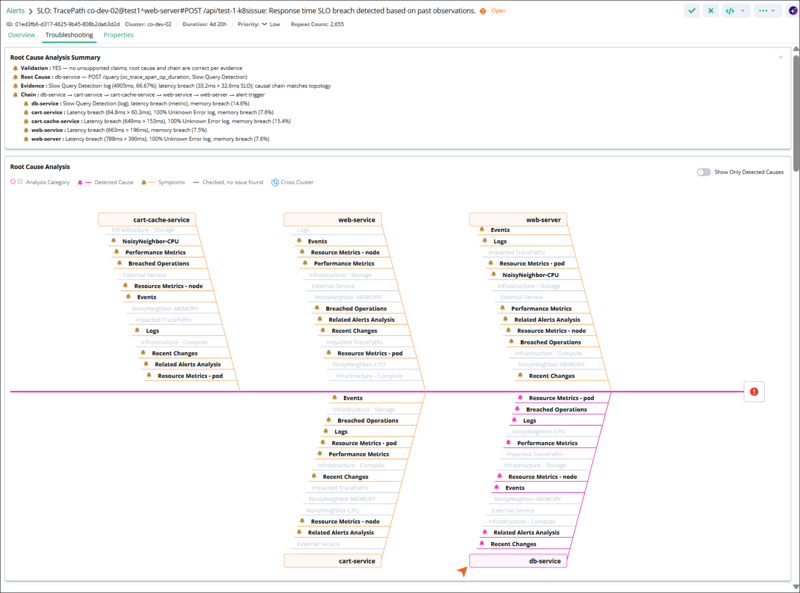 |
The Troubleshooting tab shows the Root Cause Analysis Summary with validation, root cause, evidence, and chain, and a fishbone diagram in which the terminal service is marked as the detected cause and the other services are marked as symptoms.
The Root Cause Analysis Summary describes the most likely cause in a few lines. Virtana CO builds the summary from the evidence that the analysis collects and presents it in the following parts.
Validation: Whether the analysis supports the stated root cause and chain, based on the collected evidence.
Root Cause: The service and operation identified as the origin of the slowdown, with the metric and log condition that point to it, for example, a slow query detected on
db-serviceforPOST /query.Evidence: The supporting signals, such as a log detection with its frequency, the latency breach against the SLO, and confirmation that the causal chain matches the trace path topology.
Chain: The causal chain from the originating service through the calling services to the alert trigger, with the breaches detected at each service.
The Root Cause Analysis diagram shows every trace service in the breaching path as a fishbone, with the analysis categories that CO evaluated for each service. The diagram uses color to distinguish the categories that identified an issue from those that did not.
A Detected Cause (pink) is a category where CO found the issue that most likely caused the slowdown.
A Symptom (orange) is a category that shows an effect of the root cause rather than its origin.
Checked, no issue found (gray) is a category that CO evaluated but where it found no issue.
Enable the Show Only Detected Causes to hide the categories that found no issue and focus on the detected causes and symptoms. A Cross Cluster indicator marks a contributing service that runs in a different cluster.
The diagram usually marks more than one service as breaching, and marks the terminal service as the detected cause. This happens because each service operation's measured duration includes the time spent in the operations it calls. Latency introduced by the terminal service is therefore counted in every service that calls it along the path, so those services also show a latency breach. CO identifies the terminal service in the breach chain, the deepest service where the latency originates, as the detected cause, and classifies the other breaching services as symptoms.
For each service, CO reports the following analysis categories.
Root Cause Analysis category | What CO evaluates |
|---|---|
Breached Operations | The traced operations in the service that exceeded their latency threshold, with the operation one level before and one level after in the path for context. |
Performance Metrics | The RED metrics (request rate, error rate, and duration) for the service and its operations during the alert window. |
Resource Metrics - pod | CPU, memory, and disk utilization for the pods that back the service. |
Resource Metrics - node | CPU, memory, and disk metrics for the nodes that host the pods, to reveal infrastructure pressure. |
Logs | Error indicators in the logs of the pods that back the service, such as slow query detections, timeouts, unknown errors, and connection failures. |
Events | Kubernetes events for the affected pods and nodes, such as scaling actions and node conditions. |
Recent Changes | Recent image or configuration changes that correlate with the start of the slowdown. |
Related Alerts Analysis | Existing service- or operation-level alerts that are linked to the tracepath. |
NoisyNeighbor-CPU and NoisyNeighbor-MEMORY | Whether a co-hosted pod or process on the same node consumed excessive CPU or memory and starved the service's pod of resources. |
Infrastructure - Compute and Infrastructure - Storage | Compute or storage pressure on the underlying infrastructure. |
External Service | Whether a downstream or external dependency, such as a database endpoint or third-party API, is slow or generates an error. |
Impacted TracePaths | Other tracepaths affected by the same deviating service operation, to help you assess the broader impact. |
Analyze an impacted service
To investigate the evidence behind a detected cause or symptom, select a service in the root cause analysis fishbone diagram. The troubleshooting tab drills into that service and shows a detailed dashboard for it. A breadcrumb at the top of the tab shows which service you are viewing.
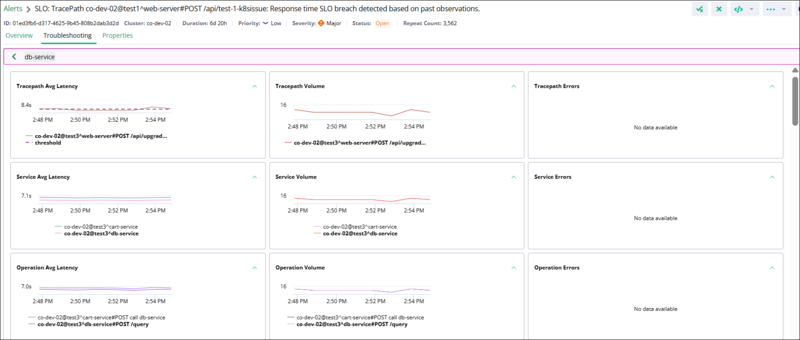 |
The drill-down dashboard for a specific service, showing tracepath, service, and operation latency, volume, and error charts; latency-versus-node and latency-versus-pod resource charts; an events correlation timeline; a recent changes timeline; a logs table; related alerts; and the trace and vertical topology.
The dashboard groups the metrics for the selected service into the following panels, ordered from the application layer down to the supporting infrastructure and topology.
Panel | Description |
|---|---|
Tracepath Avg Latency | The average response time of the affected tracepath over the alert window, plotted against the SLO threshold. |
Tracepath Volume | The number of requests on the tracepath over the same window. |
Tracepath Errors | The count of error requests on the tracepath. The panel shows No data available when there are no errors. |
Service Volume | The request volume handled by each trace service. |
Operation Avg Latency | The average latency of each trace operation, such as the selected service's |
Operation Volume | The request volume for each trace operation. |
Tracepath Avg Latency vs Node CPU Usage | The tracepath latency overlaid on the CPU utilization of the node that hosts the service's pod, to reveal CPU pressure that tracks the slowdown. |
Tracepath Avg Latency vs Node Memory Usage | The tracepath latency overlaid on the node's memory utilization. |
Tracepath Avg Latency vs Pod CPU Usage | The tracepath latency overlaid on the CPU utilization of the pod that backs the service. |
Tracepath Avg Latency vs Pod Memory Usage | The tracepath latency overlaid on the pod's memory utilization. |
Events Correlation Timeline | Kubernetes events across the Deployment, Node, Pod, and Container layers on a shared timeline, color-coded as a warning (pressure or failure) or normal, so you can spot events such as node scaling or a certificate expiration warning that line up with the slowdown. |
Recent Changes Timeline | Deployment, image, or configuration changes for the services over time, so you can correlate a change with the onset of the latency increase. |
Logs with Errors and Exceptions | Log entries from the service's pods that contain errors or exceptions, with the timestamp, error type, matched keywords, percentage of occurrences, and the message text. |
Related Alerts | Other alerts related to the selected service or its infrastructure, with the relation (such as child), repeat count, source, entity type and name, and when each was first and last seen. |
Trace Topology | The tracepath drawn as a left-to-right service flow, with the average latency, request count, and error count for each hop, so you can see where latency and errors accumulate. |
Vertical Topology | The infrastructure stack that backs the selected service, the hosts or virtual machines, and the node, so you can trace the service down to the infrastructure it runs on. |
Properties tab
The properties tab shows the full alert metadata, which is useful when you correlate the alert with other systems or verify how it was generated.
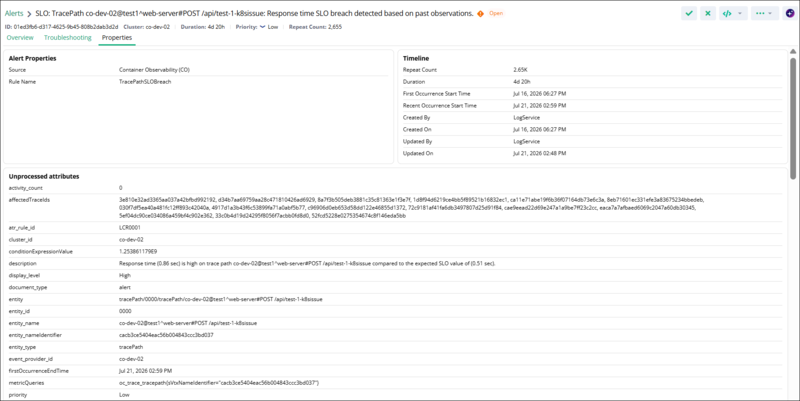 |
The properties tab shows alert properties, a timeline with occurrence times and repeat count, and the unprocessed attributes for the tracepath alert.
The tab groups the metadata into alert properties, a timeline, and the raw alert attributes. The following properties are the most useful for identifying and classifying a tracepath RCA alert.
Property | Meaning |
|---|---|
Source | The originating product, Container Observability. |
Rule Name | The rule that raised the alert, |
problemCategory and problemSubCategory | The classification of the problem, |
entity_type | The alerted entity type, |
metricQueries | The query for the alerted metric, based on |
thresholdValue | The dynamically computed SLO threshold that the response time breached. |
Repeat Count and Duration | How many times the breach recurred and how long the alert has been open. |
affectedTraceIds | The IDs of the individual slow traces that contributed to the alert. |
Act on a tracepath RCA alert
Use the following workflow to move from a tracepath RCA alert to a corrective action.
In the Global View Alerts list, filter by the
tracePathentity type to find tracepath RCA alerts, and select the alert you want to investigate.On the Overview tab, review the What Happened and Target Entity panels to confirm which tracepath is affected and how far its response time exceeded the SLO.
Open the Alerted Metrics sub-tab to see when latency breached the threshold, and open the Topology sub-tab to see the service-to-service flow of the tracepath.
On the Troubleshooting tab, read the Root Cause Analysis Summary to see the identified root cause and the supporting evidence.
In the Root Cause Analysis diagram, turn on Show Only Detected Causes and review the detected cause on the terminal service, then review the analysis categories, such as Logs, Events, and Recent Changes, that support it.
Use the Related Context links to pivot to the Service Performance dashboard, the Application State view, and the relevant logs for further investigation.
Take a corrective action based on the root cause category, such as scaling a deployment, adjusting resource limits, rolling back a recent image change, or addressing an external dependency.
Note
Tracepath RCA alerts are generated at the tracepath level. An individual slow transaction does not create its own alert. Instead, each matching slow trace contributes to the repeat count and activity of the parent tracepath RCA alert, and its trace ID appears in the alert's affected trace IDs.
Agentic RCA for alerts
Agentic root cause analysis (RCA) runs an automated investigation for an alert and presents the findings on the Troubleshooting tab of the alert. Instead of manually checking the storage, fabric, datastore, and compute layers, Agentic RCA gathers evidence automatically and presents the findings as a written summary and a fishbone diagram.
You can start an investigation in two ways:
Manually: Ask Copilot to start an investigation for the alert you have open.
By policy: Define a policy, and Global View starts an investigation for every new alert that matches it.
Important
Agentic Root Cause Analysis (RCA) is currently supported for IO alerts only.
Before you begin
Agentic RCA uses data collected from the Model Context Protocol (MCP) endpoint on the IO appliance that generated the alert. Make sure the following requirements are met before you run an investigation on an alert that comes from an IO appliance:
Agentic RCAs can take longer to complete than the default token timeout. To avoid the session expiring while an RCA is running, set the access token validity timeout to 1 hour.
The Virtana AI Copilot is enabled in your Global View deployment. You can start and track investigations from the Ask Copilot panel, which appears only when the Copilot is enabled. For more information, see Set up the Virtana Copilot chatbot.
The IO MCP endpoint for the appliance that raised the alert is registered in Global View. Agentic RCA connects to that endpoint to run the investigation, so an investigation cannot run for an appliance that is not registered. For more information, see Set up the IO MCP in Global View.
For the IO RCA feature to function, your IO environment must be running IO version
io-2026.9.1.The
IO_MCP_ENDPOINTconfiguration must be properly configured and reachable.If the IO server presents an invalid or untrusted TLS certificate, Global View rejects the connection to the IO MCP endpoint and the investigation cannot run. If a valid certificate is not available in your on-premises environment, add/ enable the
use_io_mcp_proxyfeature flag in GrowthBook to route the connection through a proxy. For more information, see Enable Growthbook feature flags.If the iomcpsecret (or IO_MCP_ENDPOINT) configuration is added or updated after Global View deployment, restart both the virtana-ai and alerts-service pods so they load the new configuration.
For details on updating certificates and restarting services, see Deploying Global View.
Start an investigation from an alert
You start an agentic RCA investigation by asking Copilot to investigate the alert you are viewing. Copilot takes the alert as the scope of the investigation, so you do not need to describe the entity, the rule, or the metric in your prompt.
Log in to the Virtana Platform and open the Global View.
In Global View, open Alerts and click the alert you want to investigate.
Click the Troubleshooting tab.
In the Message Copilot box, enter
Start investigationand submit the prompt.Copilot confirms that the investigation has started and returns an Investigation ID along with the scope of the investigation.
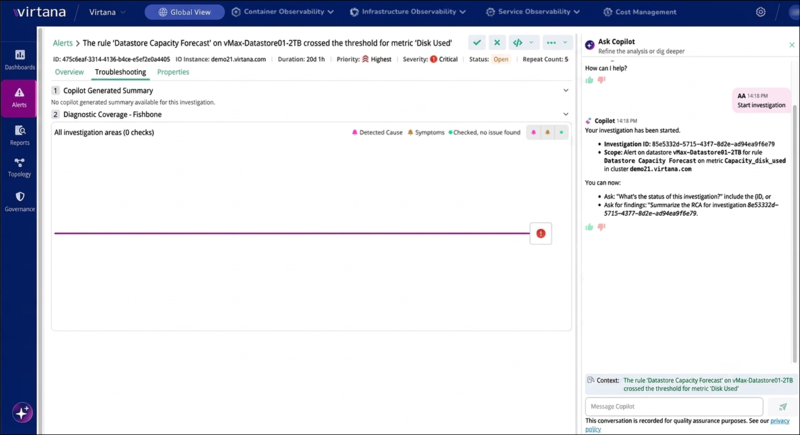
Make a note of the Investigation ID.
You need the ID to ask Copilot about this specific investigation later, which matters most when several investigations are running at the same time.
To view the status in the Message Copilot box, enter
Status investigationand submit the prompt.Copilot returns the Investigation ID, the current status, such as
RUNNING, and a short progress message.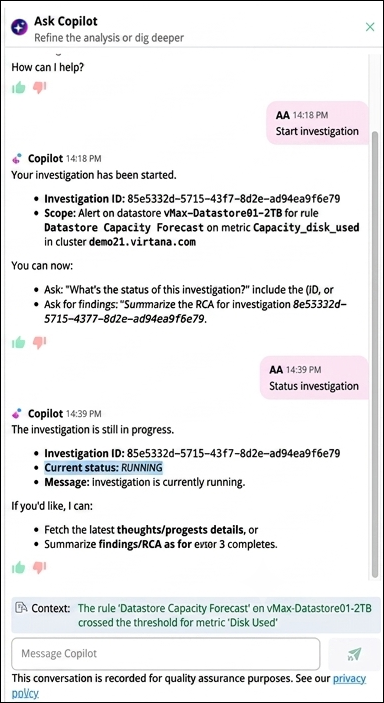
The following table lists the prompts that you can use to start an investigation and to track it:
Copilot prompt | What Copilot returns |
|---|---|
| Confirmation that an investigation has started for the alert you have open, with the Investigation ID and the scope of the investigation. |
| The current status of the investigation for the alert you have open, such as |
| The status of the specific investigation whose ID you supply, regardless of which alert you have open. |
| The findings of the named investigation, once it has completed. |
Review the investigation results
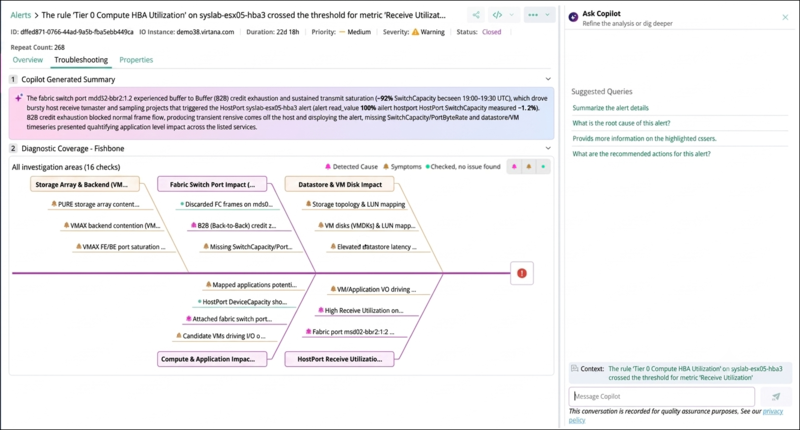
When an agentic RCA investigation completes, the Troubleshooting tab of the alert shows the findings in two sections: Copilot Generated Summary and Diagnostic Coverage - Fishbone.
Copilot Generated Summary: The summary explains, in a short narrative, what the investigation concluded: the component that drove the alert, the behavior it produced, the measured values that support the conclusion, and any data the investigation could not obtain. Until the investigation is complete, this section shows that no summary is available yet.
Diagnostic Coverage - Fishbone: The fishbone diagram shows every area the investigation examined, grouped into branches such as Storage Array & Backend, Fabric Switch Port Impact, Datastore & VM Disk Impact, Compute & Application Impact, and HostPort Receive Utilization. The heading above the diagram reports how many checks the investigation ran; for example, All investigation areas (16 checks).
Click a node in the fishbone diagram to open the supporting evidence for that check, including the metrics that the investigation sampled and the values it measured.
 |
After an investigation completes, the Ask Copilot panel offers suggested queries that you can click instead of typing, such as:
Summarize the alert details,
What is the root cause of this alert?,
Provide more information on the highlighted issues,
What are the recommended actions for this alert?
Policy-based RCA
Policy-based RCA automatically starts investigations for alerts that match predefined conditions. Defined policy sets the conditions that an alert must meet, for example, its source instance, severity, priority, or entity type. When a new alert matches those conditions, Global View starts an agentic RCA investigation for it in the background, and the summary and fishbone diagram appear on the alert's Troubleshooting tab when the investigation completes.
By default, agentic RCA is automatically generated for IO critical alerts only. If you want to override the default behavior and modify the triggering criteria (such as applying RCA to other alert severities or specific entity types), contact Virtana Support.
For the IO RCA feature to function, your IO environment must be running IO version io-2026.9.1 . And The IO_MCP_ENDPOINT configuration must be properly configured and reachable.
Policy-based RCA evaluates alerts at two levels:
Policy-level criteria: Pre-filters the alerts evaluated by the policy (such as source instance, entity type, priority, or severity).
Action criteria: Specifies which subset of matching alerts trigger a specific action and sets the depth of analysis Global View performs.
Policy creation and customization are managed by Virtana Support and are not directly configurable in the UI.