Executed Actions
Use the Executed Actions to review the actions that Virtana ran in response to your alerts and policies, confirm whether each action succeeded, and investigate the ones that failed. An action is a task that resolves or responds to a problem, such as sending a notification or running a remediation script. An action provider is the system that supplies the action, and an action execution is a single run of that action, with its own status, runtime values, and logs. The Executed Actions page groups executions by action provider, shows how often each action ran, and lets you open the individual execution records behind every count. For the full list of action terms and concepts, see Reports.
Open Executed Actions
Perform the following steps to open the Executed Actions page:
Log in to the Virtana Platform and open Global View.
In the left navigation, go to Reports > Executed Actions.
The Executed Actions page opens.
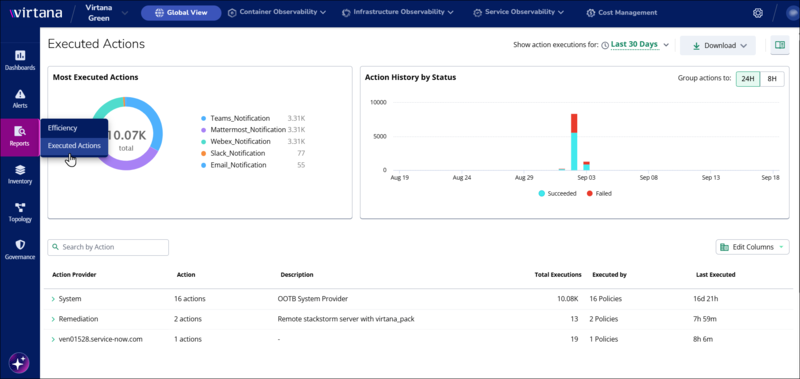
The Executed Actions page shows the Most Executed Actions and Action History by Status panels across the top row, and the executed actions table below them. The panels summarize which actions ran most often and how many executions succeeded or failed over time. The table breaks the same data down by action provider, so you can expand a provider, open an individual action, and read the details of a single execution. All three areas report on the period that you select in the page header.
Summary panels
The two panels at the top of the page answer two different questions: which actions your environment runs most often, and whether those actions succeed. Read them together before you open the table, because a high execution count with a visible block of failures tells you which action to investigate first. The following table describes each panel:
Panel | Description |
|---|---|
Most Executed Actions | A doughnut chart of the actions that ran most often in the selected period. The center of the chart shows the total number of executions, for example, 10.07K. The legend lists each action with its own execution count, for example, Teams_Notification 3.31K. Point to a segment to see the action name and count for that segment. |
Action History by Status | A bar chart of executions over time, with one bar for each interval in the selected period. Each bar is divided by outcome, and the legend below the chart identifies the two outcomes: Succeeded and Failed. To change the interval that each bar covers, select 24H or 8H next to Group actions. |
Executed actions table
The executed actions table lists every action provider that ran an action in the selected period, with a summary row for the provider and one row for each of its actions. The provider row totals the executions of all its actions, and the action rows show how each individual action contributed to that total. To expand a provider and see its actions, click the arrow next to the provider name.
The following table describes each column in the executed actions table:
Column | Description |
|---|---|
Action Provider | The system that supplies the action. Your list depends on the integrations that you configure. Examples include System for the actions that ship with Virtana, Remediation for a remote StackStorm server, and the host name of your ServiceNow instance. |
Action | The number of actions that the provider supplies, for example, 16 actions, in a provider row. In an action row, this column shows the name of the individual action, for example, Slack_Notification. |
Description | A brief description of the provider or the action, for example, OOTB System Provider for the System provider, or Email notification action for an individual action. A dash indicates that Virtana has no description for the provider. |
Total Executions | The number of times the provider or the action ran in the selected period. |
Executed by | What triggered the executions. A provider row shows the number of policies that ran its actions, for example, 16 Policies. An action row names the policy, user, or client that ran the action, for example, Client: service-account. |
Last Executed | The time that has passed since the most recent execution, for example, 15d 23h or 10h 42m. |
To change which columns the table shows, click Edit Columns, and then select or clear the columns that you want. The Action Provider and Action columns always remain visible.
Search for an action
Search the executed actions table when you know which action you want to review, and you don't want to expand each provider to find it.
In the Search by Action field above the table, enter the full or partial name of the action, for example,
slack.The table filters to the actions that match the text you enter.
To clear the filter and show all providers again, delete the text from the field.
View the executions of an action
Open the execution list for an action when you need to know when the action ran, which alert triggered each run, and whether each run succeeded.
In the executed actions table, click the arrow next to an action provider to expand it.
Click the action that you want to review.
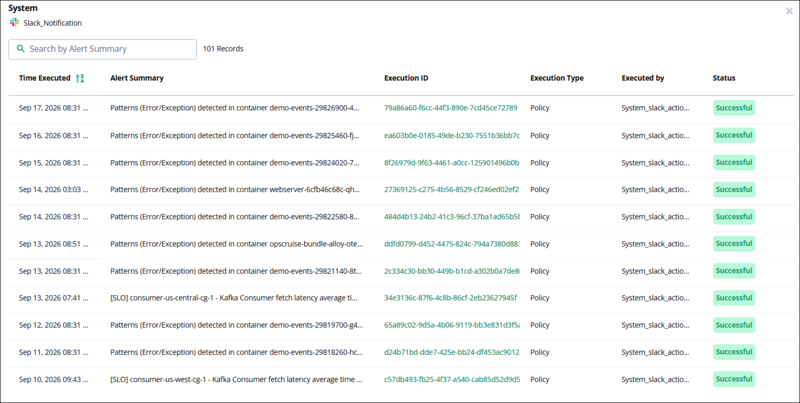
The execution list opens in a window that is titled with the provider name and the action name, and shows the total number of records.
To find a specific execution, enter text in the Search by Alert Summary field, or click the sort control in the Time Executed column to change the order of the list.
 |
The following table describes each column in the execution list:
Column | Description |
|---|---|
Time Executed | The date and time that the execution started, for example, September 17, 2026 08:31 AM. |
Alert Summary | The summary of the alert that triggered the action, for example, Patterns (Error/Exception) detected in container demo-events-29826900-4qxfx. |
Execution ID | The unique identifier of the execution. Select the identifier to open the details of that execution. |
Execution Type | What triggered the execution, for example, a policy for an action that a policy ran. |
Executed by | The name of the policy, user, or client that ran the action, for example, System_slack_action_policy_for_OpsCruise. |
Status | The outcome of the execution, either Successful or Failed. |
View the details of an execution
Open the details of an execution when you need the full record of a single run, such as the entity it acted on, how long it took, and where it stopped if it failed.
In the execution list, select the identifier in the Execution ID column.
The execution details open, with the execution identifier at the top and an Alert Details link below it.
To open the alert that triggered the action, select the alert identifier next to Alert Details. The alert opens in a new tab.
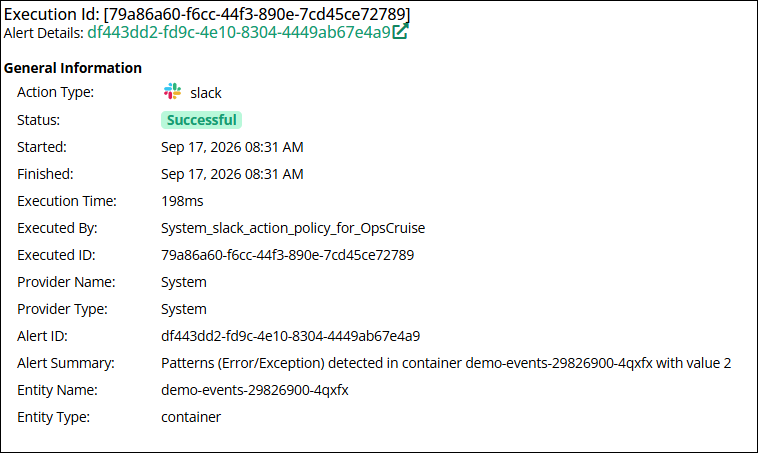 |
The General Information section reports what ran, what triggered it, and what it acted on. Below the General Information section, the Execution Steps table lists each step of the execution with the time it ran and its status. For an action that completes in a single step, the table contains one row. For a workflow, the table contains one row for each step, so you can see which step failed.
Note
An execution keeps the alert summary that the alert had when the action ran. If the alert changes after the execution, the summary in the execution record doesn't change, so the two can differ.
Report options
Three options in the page header change the period that the report covers, export the report, and open the documentation. The options apply to the whole page, not to individual panels or rows. The following table describes each option:
Option | Description |
|---|---|
Show action executions for | Sets the reporting period. The available options are Today, Last 7 Days, Last 15 Days, and Last 30 Days. Both panels and the executed actions table update to show only the executions that ran in the period that you select. |
Download | Click Download to download the PDF file that contains the current view of the report, including the two summary panels and the executed actions table. |
Help | Opens the Virtana documentation for the Executed Actions page. |