Node Map
The Node Map in enables you to view the condition of the running nodes along with services like Pods and containers of a selected node. It also indicates any anomalies detected in any container in the Node.
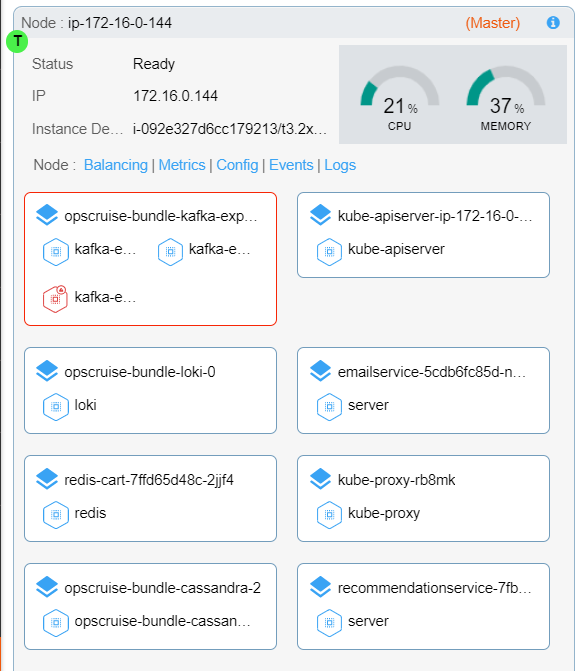 |
The following table describes the details of a particular node and the available services in the node:
Filter bar | In the Filter bar, you can filter the namespace to view any specific entity |
Node description | Provides the status of the node and the IP address of the node. |
Resource utilization summary | Shows the CPU and memory usage in a node. |
Badges on Node Map 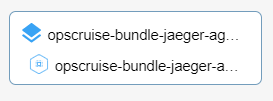 |
|
Note
Note:
You can also filter the type of Pod labels, Containers, Nodes, and Namespace to view only the specific details of a particular entity in the Node Map.
In the right corner of Node Map, you can click Clear to remove the filtered options.
In Node Map, you can select auto-refresh by clicking on the Refresh button, and on entering the desired time, the previous filtered items will be refreshed.
Determining Node Balancing
Node Balancing enables you to determine the workload conditions, resource utilization, and health of a particular node. It provides detailed information for users to make changes on balancing the resources across the services if required.
gets this information from (KSM) Kubernetes state metrics and verifies the settings, such as auto-scaling limits, are set correctly and consistently for the services in the cluster.
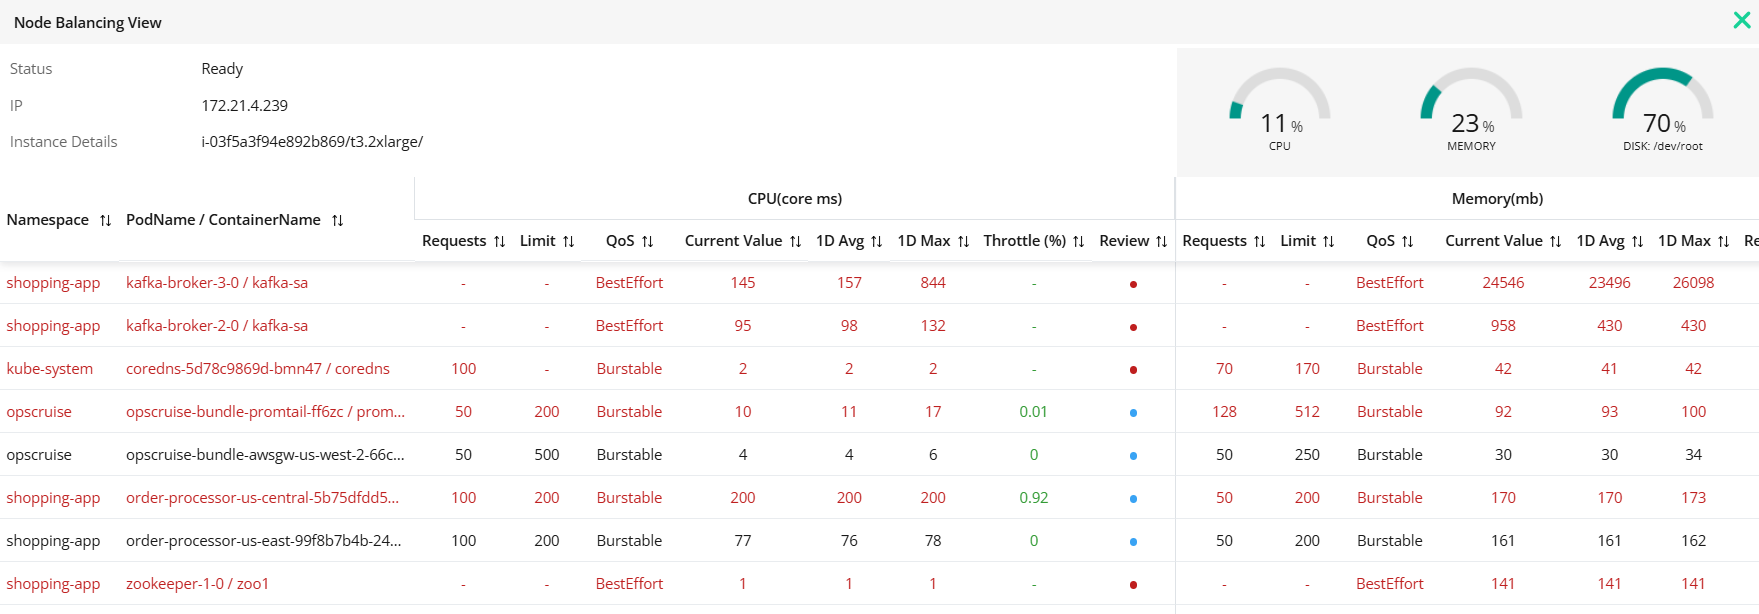 |
From the node balancing snapshot, you can analyze the following:
Status of the particular running node.
Lists all the available Pods and containers that are running and hosted by a node.
Top-right corner, the resource usage summary represents the health condition of the disk, CPU, and memory.
You can determine workloads for example: how the resources of Pods and containers are configured and balanced.
Helps you to analyze if the Kubernetes Pod limits may be invalid for the resources needed for the new container images.
Node Balancing view immediately identifies if the Pod is under-provisioned and should be migrated to nodes that have adequate capacity.
It suggests the maximum and average request of CPU, disk, and memory can be obtained along with the consumption limit per day.
Throttle percentage triggered by Pods or containers when excess CPU or memory is required.
The review depicts whether the limits and requests of Pods and containers are configured correctly per the requirements for services in the cluster.
Note
Note: The :icon: symbol in the top-right corner of the Node Map snapshot is the data collection icon. It represents the data of the last metrics received from the gateways and the status of the deployed agents (Gateways) where the status of the server is down or inactive.
Viewing Configuration and Performance Snapshot of a Node
This section enables you to view the configuration details of a particular node, the node performance details, and its resource usage.
To view configuration and performance details, perform the following:
Log in to the application.
On the sidebar, click Applications, and select Node Map. The number of nodes with services will be displayed.
On each node, under Instance Details, click Config. The Configuration and Performance Snapshot page is displayed.
Configuration Snapshot of Node
The Configuration from the Node Map page enables you to view how the different attributes of a selected node are configured.
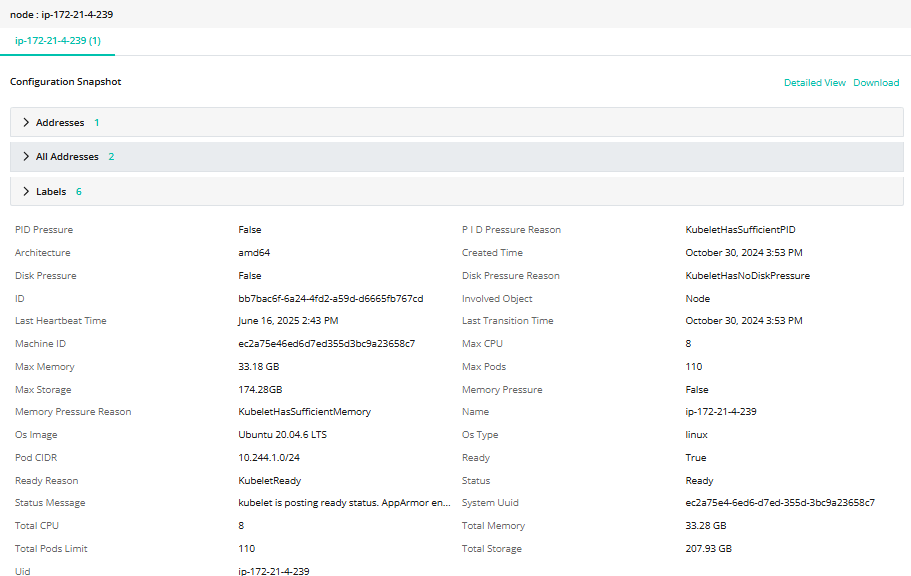 |
The Configuration Snapshot describes the following details:
Click on the labels to expand the following information:
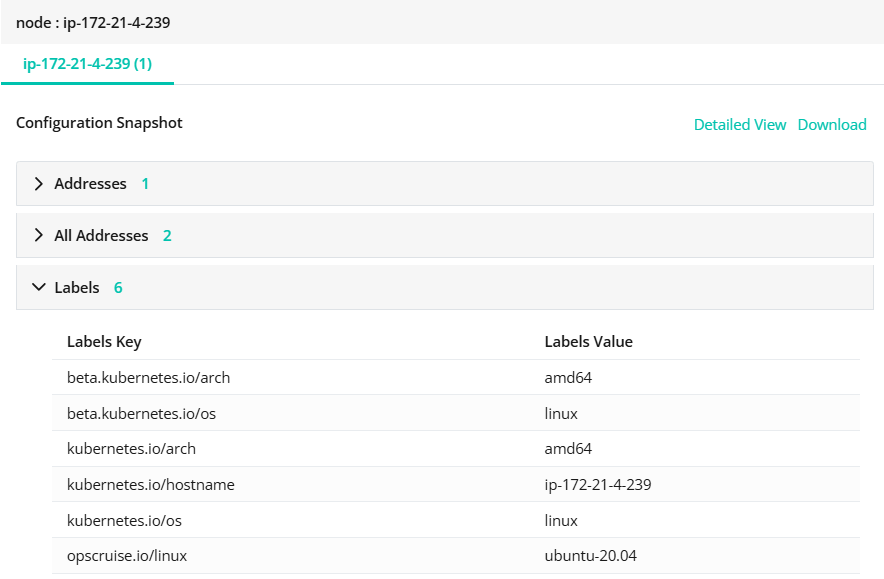 |
Label key names.
Label value of a node.
You can also view or download the YAML-configured file.
The attributes of a particular node are as follows:
CPU and memory capacity of the node.
The capacity of Pods.
Storage and Pods limits.
Performance Snapshot of a Node
The Performance Snapshot page shows the performance of a particular node in terms of requests, response times, error counts if any, and resource utilization.
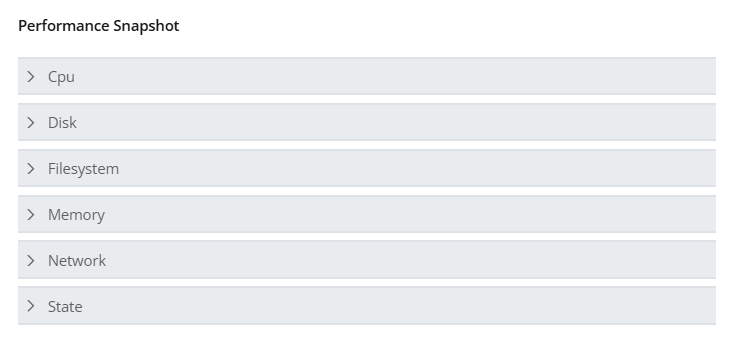 |
Click on the CPU to expand the resources usage and performance of transmit/receive of the Pod network flow in bytes.
Node_CPU_utilization
Node_load1
Node_context_switches_total
NodeCpuAggregatedSectotal
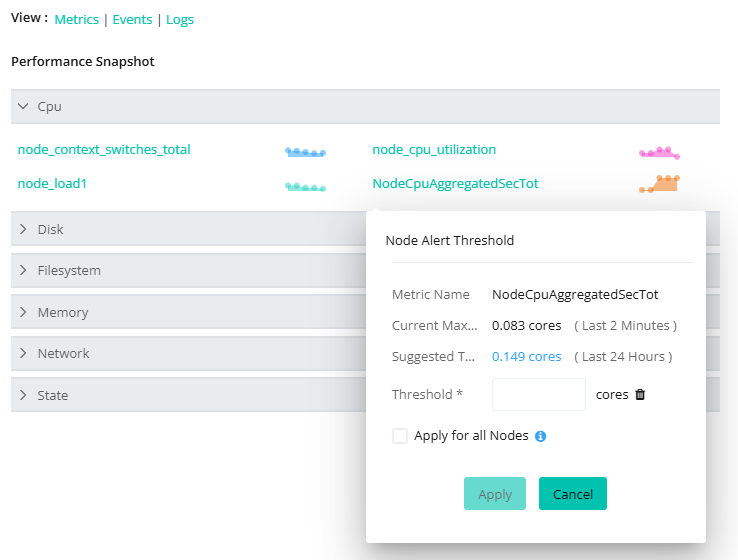 |
Hovering over each graph will display the metrics data of the node in each time interval.
Note
Note: You can also set the threshold SLO target for the metric of the node.
Viewing Configuration and Performance Snapshot of the Pod and Container in a Node
This topic helps you to view the metrics health, configuration details, and performance of Pod entities and containers belonging to a selected Pod.
To view the configuration and performance snapshot, perform the following:
Log in to the application.
On the sidebar, click Applications and select Node Map.
On Node Map, click on the badges to view the Pod and its containers.
Click on the Pod icon. The Configuration and Performance Snapshot window will display.
Similarly, click the Container icon to view the configuration and performance details
Configuration Snapshot Details of Pod in a Node
This topic describes configuring a Pod and its attributes.
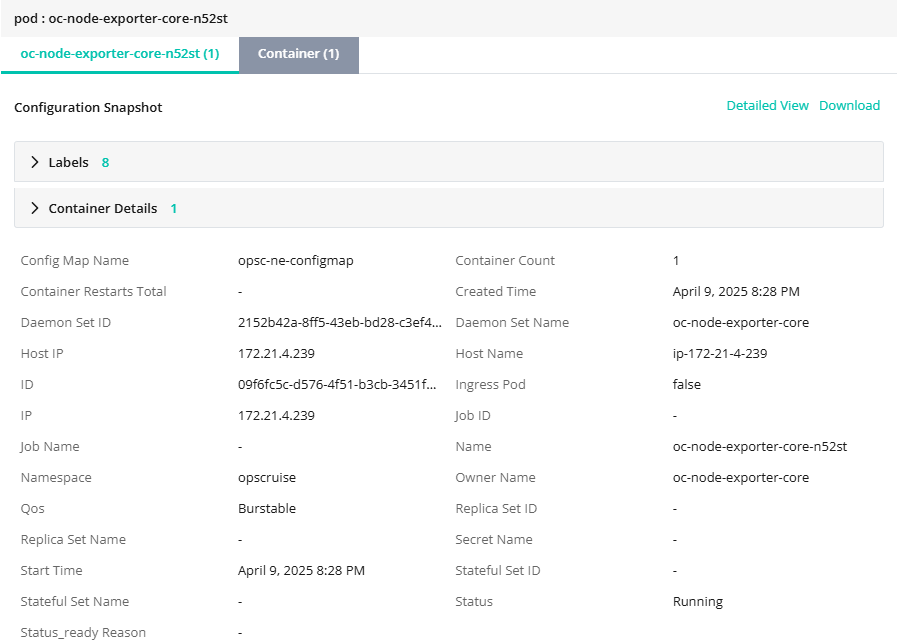 |
Configuration snapshot represents the following details:
Name of the current Pod, status, start time, and created time of the Pod.
Click on the Labels, to expand the following information:
Label key names.
Label key values of a Pod are listed.
Note
Note: Similarly, you can also view the configuration details of Containers that belong to a selected Pod.
Performance Snapshot Details of Pod in a Node
Performance snapshot enables you to analyze the health of the Pod in terms of requests, response times, and error count of the network flow from a selected Pod and its container.
 |
Performance snapshot lists the network of a selected Pod.
Click “>” to expand the Pod networks:
Network_receive_bytes
Network_transmit_bytes
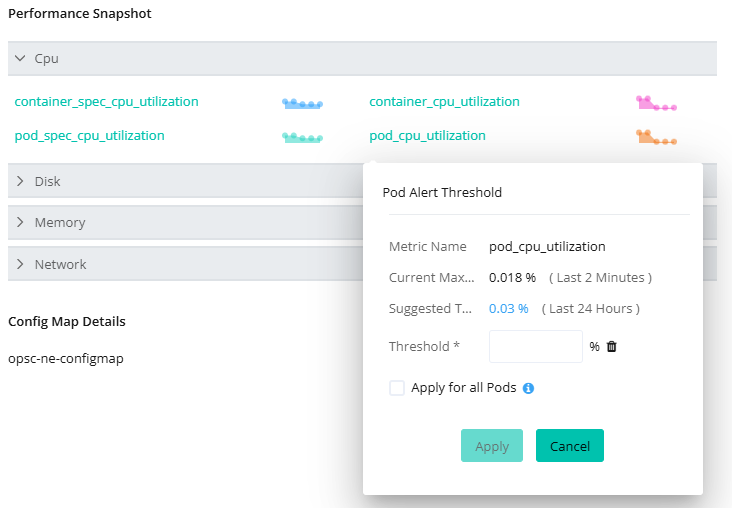 |
Hovering on the metric graph will display the amount of the network transmitted and received in bytes by a Pod at each time interval.
Note
Note:
Similarly, you can also view the performance snapshot details of all the containers for a selected Pod.
You can also download the Config Map YAML configured file for reference.
Under Performance Snapshot, you can also view the Metrics, Logs, and, Events of Pods, Containers, and Nodes.