Virtana Platform
The Virtana Platform is a unified SaaS solution (can be deployed on-prem or cloud) designed to simplify the migration, deployment, and ongoing optimization of hybrid and multi-cloud environments. The platform brings infrastructure visibility, analytics, and operational intelligence into a single environment, so you can manage complex IT ecosystems with greater clarity and control.
The platform delivers observability across both on-premises infrastructure and cloud environments, enabling IT teams to monitor workloads whenever they run. It gathers high-definition, granular operational data from across the stack to give you insights into system behavior and performance patterns. The data is then analyzed using AIOps-driven analytics powered by machine learning and advanced data analysis, allowing the platform to detect anomalies, identify trends, and generate actionable insights that support proactive decision-making. It then analyzes this data with AIOps analytics, to detect anomalies, identify trends, and generate actionable insights that support proactive decision-making.
These capabilities help you maintain consistent performance and high availability across your environments and optimize cost and resource capacity as workloads scale. The platform also supports governance and compliance requirements, so teams can maintain policy alignment and operational accountability across hybrid and multi-cloud infrastructures. By combining observability, analytics, and operational governance in a single application, the Virtana Platform helps you manage cloud complexity and make informed infrastructure decisions.
Core modules
The core modules of the Virtana Platform deliver observability, operational intelligence, and cost optimization across hybrid environments. These modules are Global View, Container Observability, Infrastructure Observability, Service Observability, and Cloud Cost Management. Together, they provide a unified, scalable architecture for monitoring applications, infrastructure, and cloud resources.
Global View (GV)
Global View provides a centralized, unified dashboard for monitoring and managing performance across your entire application and infrastructure. It enables you to monitor systems, analyze performance trends, and respond to issues from a single, cohesive interface.
The platform consolidates insights from multiple environments, whether on-premises, cloud, or hybrid, into a single pane of glass. Global View is also built to support multi-tenant architectures and complex organizational hierarchies, making it well-suited for enterprises and managed service providers that need to manage multiple customers, departments, or business units within the same platform. The dashboard continuously surfaces real-time operational intelligence, including metrics, events, alerts, and governance signals.
By presenting this information in a clear and consolidated format, Global View enables teams to quickly detect anomalies, address potential issues, and ensure that infrastructure performance, reliability, and compliance remain aligned with organizational objectives.
Container Observability (CO)
Container Observability is designed to provide deep visibility into applications running in Kubernetes-based environments. As containerized workloads become increasingly dynamic and distributed, this capability helps teams understand how applications behave across clusters, ensuring that performance, reliability, and resource utilization remain optimized.
Container Observability continuously monitors the performance and health of Kubernetes workloads at multiple layers, including the application, pod, and container levels. To support faster analysis and troubleshooting, CO offers intuitive visualization tools such as AppMap and NodeMap, which illustrate application dependencies and infrastructure relationships. In addition, tools like Data Explorer and System Status views provide detailed access to operational metrics and system conditions. The platform enables topology-aware troubleshooting, helping teams drill down into specific workloads and infrastructure components when investigating issues.
Infrastructure Observability (IO)
Infrastructure Observability provides comprehensive monitoring for physical, virtual, and cloud-based infrastructure, giving organizations the visibility needed to maintain performance, stability, and operational efficiency across their IT environments.
The platform collects and correlates metrics from a wide range of infrastructure layers, including SAN/NAS storage systems, compute resources, hypervisors, and network infrastructure. To support proactive operations, IO surfaces real-time alerts and interactive dashboards that highlight key indicators related to capacity, performance, and overall system health.
In addition, IO integrates seamlessly with Global View, extending its capabilities to deliver unified, cross-stack visibility across infrastructure and application environments.
Service Observability
Service Observability collects and correlates metrics, events, logs, and dependency data to provide a unified view of service health. It delivers full-stack monitoring and observability for IT services across hybrid and multi-cloud environments. It features dynamic service modeling that automatically maps dependencies across servers, networks, databases, middleware, and enterprise applications, enabling rapid root-cause analysis by showing the impacts of one component on others.
With extensible data collection via Collection Zones and ZenPacks, it supports a wide range of protocols (such as SNMP, ICMP, SSH, HTTP, SQL, and more) to monitor virtually any infrastructure element. Key capabilities include a smart event console for intelligent alert management, customizable dashboards, inventory and topology views, site availability monitoring (SAM), and service impact analysis to prioritize issues based on business impact.
Cloud Cost Management (CCM)
Cloud Cost Management is designed to give organizations full visibility and control over their cloud spending, helping balance cost efficiency with operational performance. CCM provides the insights and guidance needed to optimize resources while maintaining service quality.
The platform tracks and analyzes cloud expenditures across accounts and services. By continuously evaluating usage patterns, CCM identifies areas of waste and opportunities for rightsizing, ensuring that cloud resources are aligned with actual demand and business requirements. CCM goes a step further by recommending actionable changes that reduce unnecessary costs without compromising performance or availability.
Virtana Architecture
The Virtana Platform architecture uses a Kubernetes-based design that supports centralized management, distributed data collection, and unified observability across hybrid and multi-cloud environments. The architecture is organized into distinct layers that together provide authentication, monitoring, analytics, and automation capabilities.
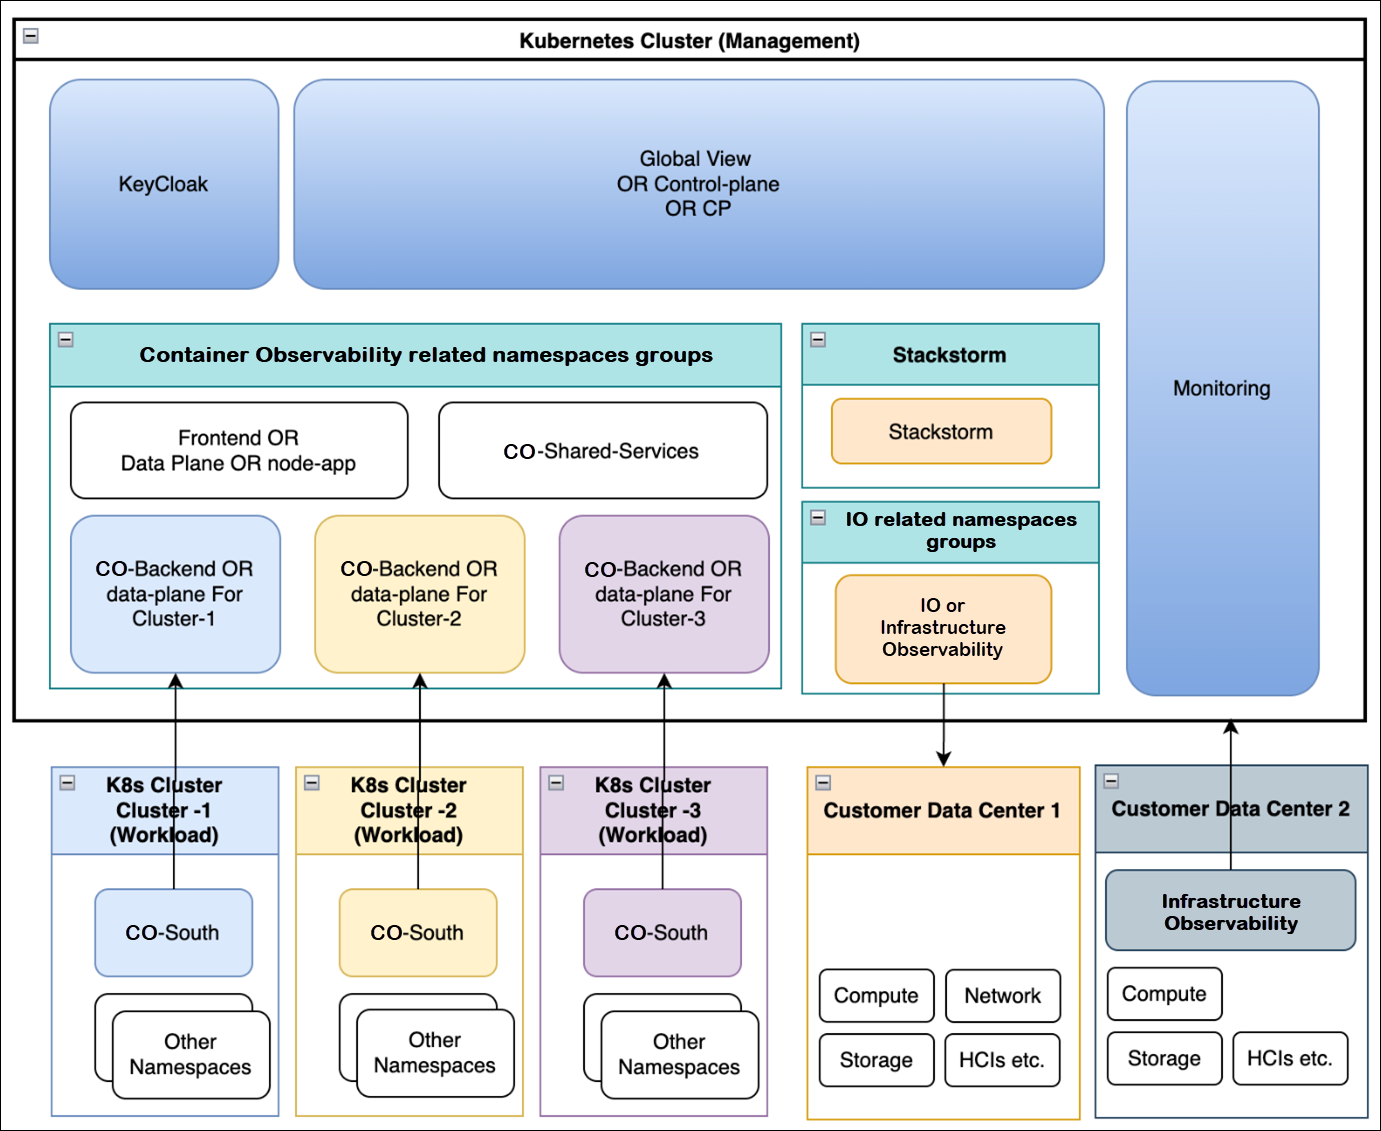 |
The architecture centers on a management Kubernetes cluster that acts as the control plane for the entire solution. This cluster hosts the Global View/Control Plane service, which provides the primary user interface and orchestration functions.
Within this management cluster, the platform is logically segmented into namespaces for core capabilities. The CO layer includes the UI and data‑plane components, shared services, and a set of CO backends that scale horizontally, one for each connected workload cluster. The IO layer is responsible for ingesting, processing, and analyzing infrastructure telemetry, while a separate StackStorm namespace provides the automation and workflow engine used to drive actions across the environment.
Beneath the management plane, multiple Kubernetes workload clusters run customer applications. Each of these clusters includes a CO‑South component that sits close to the workloads, collecting cluster‑level and application‑level telemetry and sending it back to the CO services in the management cluster. These workload clusters are otherwise standard Kubernetes environments with their own customer namespaces and services.
In parallel, the platform extends into customer data centers, where traditional infrastructure, such as compute, storage, networking, and Hyperconverged Infrastructure (HCI) platforms, is monitored by IO collectors and services. Telemetry from these on‑premises environments is funneled into the IO layer running in the management cluster. Together, the CO and IO layers give Virtana Platform a unified view across both containerized workloads and conventional infrastructure, all coordinated through a single centralized control plane.
Global View Multi‑Tenancy architecture
Global View supports:
Multiple tenants (organizations) per deployment.
An ORG_ID (UUID) per tenant.
Per‑tenant endpoints for Container Observability and IO.
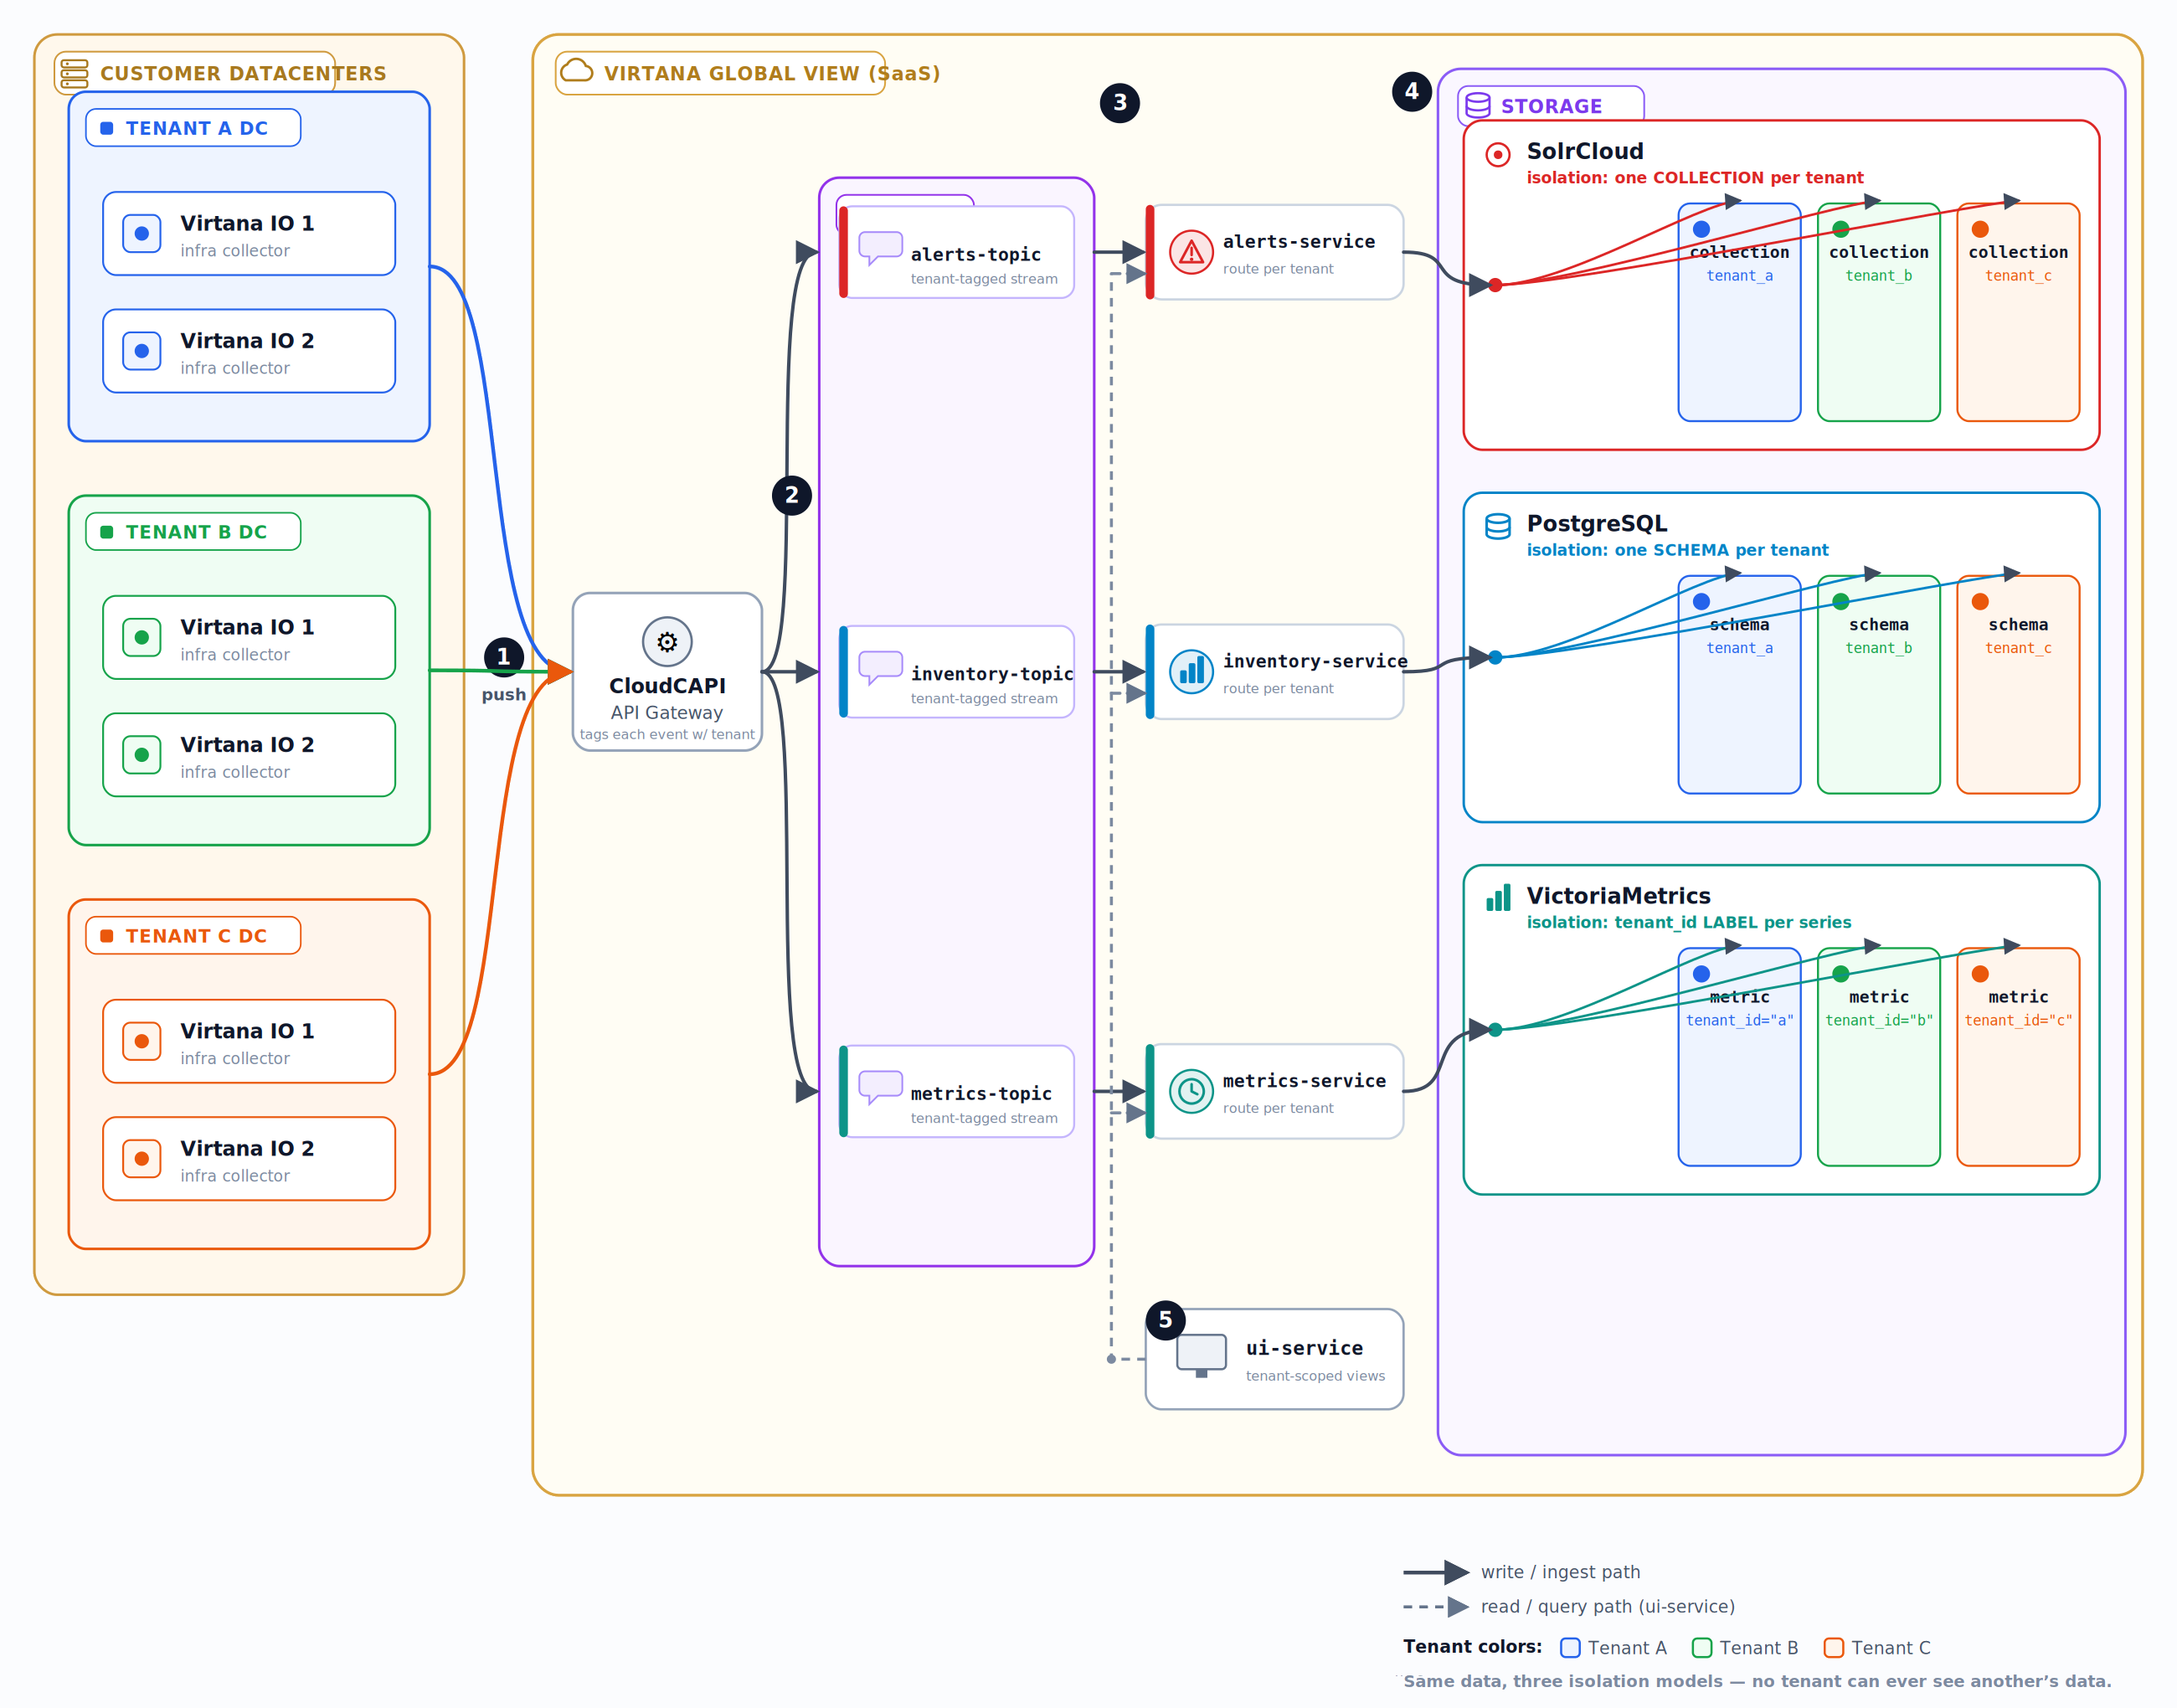 |
This diagram shows how Virtana Global View keeps every tenant's data separate, even though they all share the same platform.
Push: Each tenant's Virtana IO collectors send their data to the shared API gateway (CloudCAPI).
Tag and sort: The gateway stamps each event with its tenant, then publishes it onto the matching Kafka topic for alerts, inventory, or metrics.
Consume: Each service reads its own topic.
Store separately: Each service writes to its datastore, partitioned per tenant: SolrCloud keeps a collection per tenant, PostgreSQL a schema per tenant, and VictoriaMetrics a tenant_id label per tenant.
View: The UI service reads back only the requesting tenant's slice of data.