Snapshot comparison in Time Travel
Container Observability helps in listing anomalies, if any, by triggering an alert. The Time Travel feature facilitates viewing alerts for a selected time interval. To analyze the current and previous behavior of the cluster, you can compare the cluster state of the captured snapshots at two different time intervals.
To compare the snapshots in Time Travel, perform the steps:
Log in to Container Observability and navigate to Time Travel.
In the Choose Timestamp drop-down, select the two different times and the date as per your requirement.
Click the Compare Timestamp
 icon. The Historical Application State Changes page is displayed.
On the right corner, click the View Changes button. The Historical Application State Changes page will display the two snapshots for two different timestamps.
Viewing Application State Change between two-time intervals
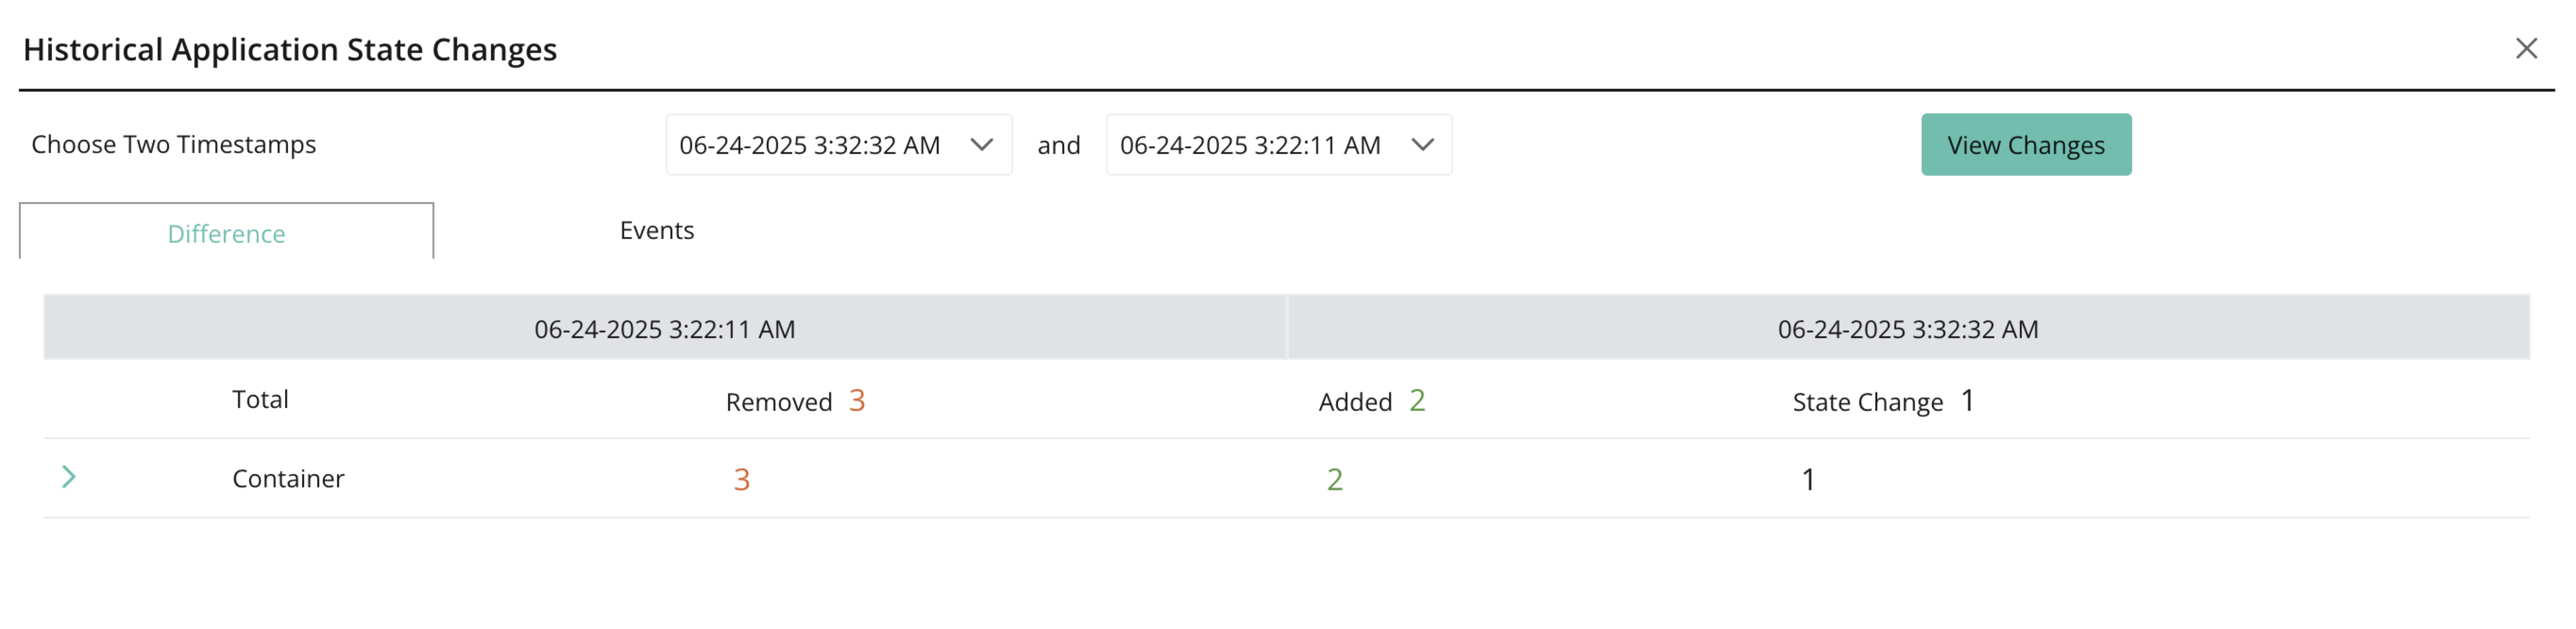
From the Historical Application State Changes page,
You can compare the behavior of services between the two selected time intervals such as the number of pods removed, pods added, and state change example: ContainerNotReady and ImagePullBackOff.
Click > to expand the services listing.
For example: Click the accordion > of Pod to expand and display the last updated status of the pod with the status message.
Click the accordion > of each pod namespace to expand and list the following details:
List of Pod services details such as state change, and behavior of service for each time interval with the status message.
Similarly, you can view the behavior and state change of Containers and SaaS between the two selected time intervals.
You can compare the snapshot details and differentiate the current and previous state change of services, and SaaS between the two selected time intervals.
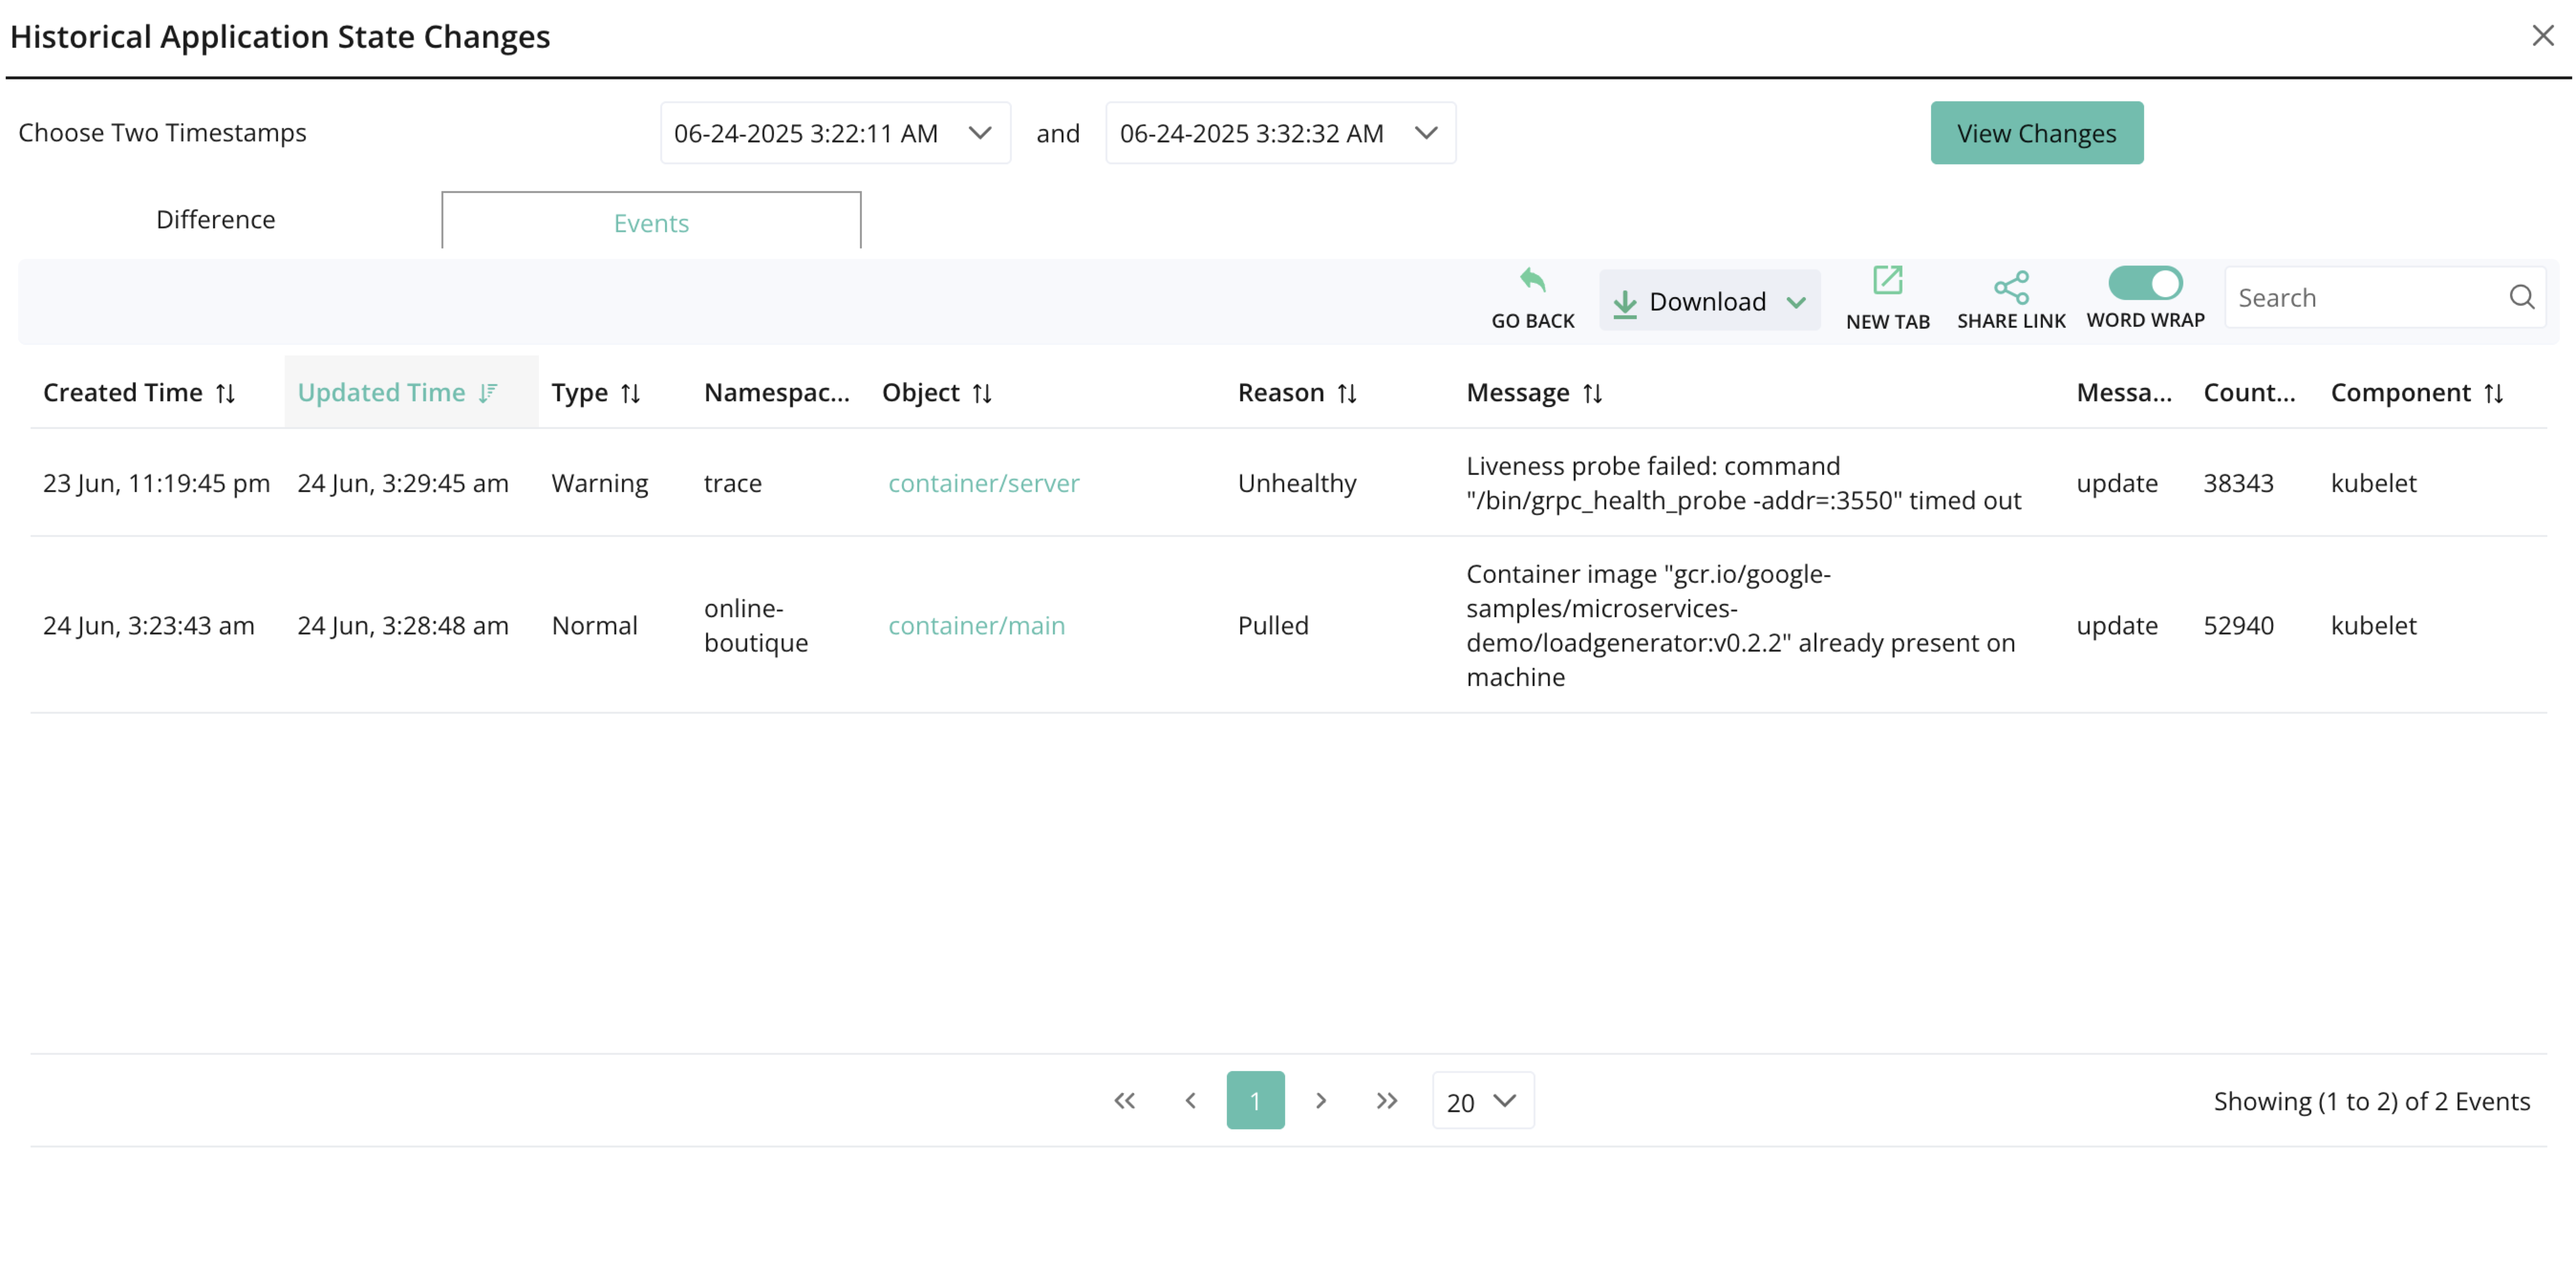
Viewing events between time intervals
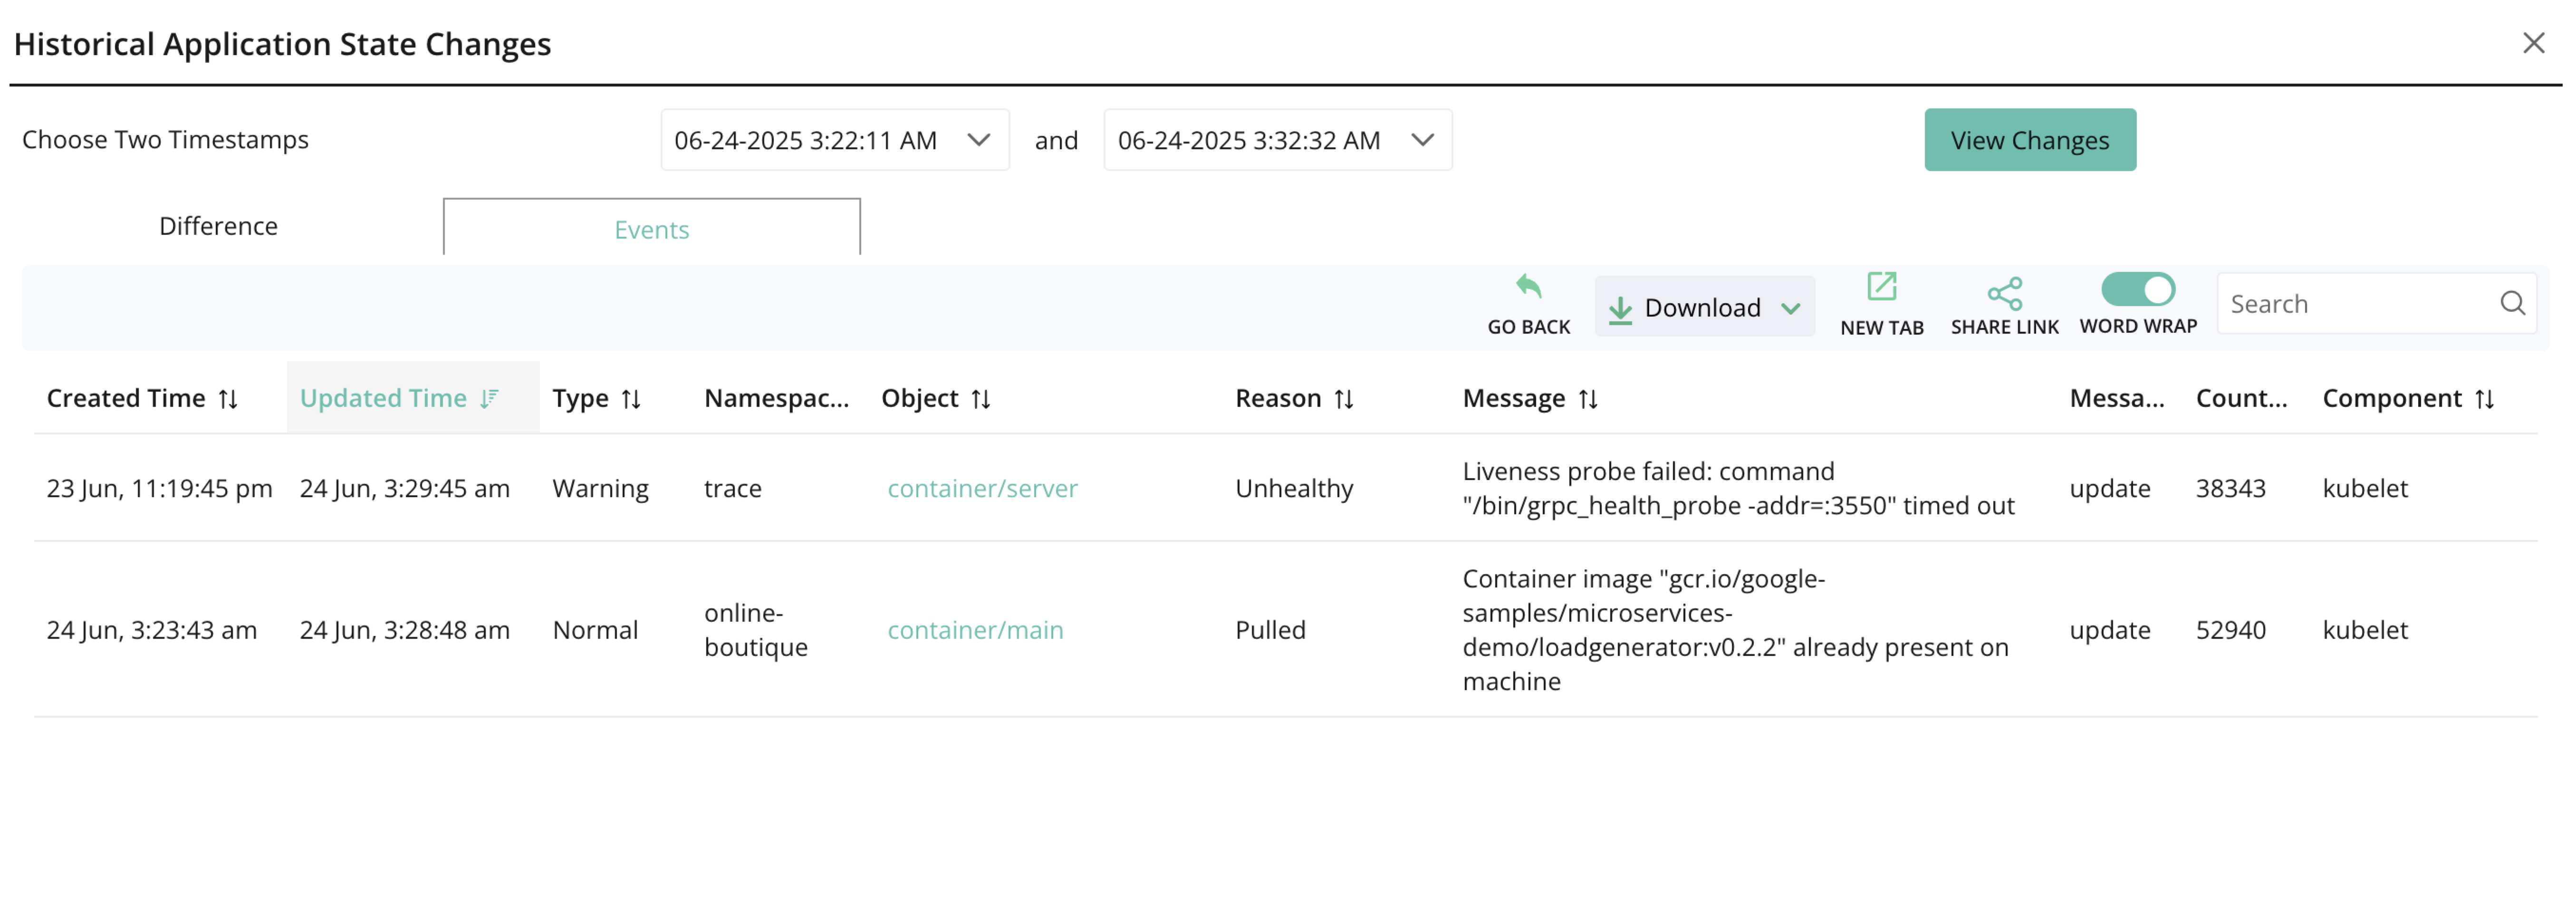
Container Observability detects and lists events that are created if there are any state changes in the cluster for time intervals. The above figure displays the list of events created due to the state change between the two selected time intervals.
The Events page describes the following:
Type of object with namespace
Created Time, Updated Time of event that occurred along with summary Message indicates the health of a particular affected object (Service).
Type of the indications:
Warning: Indicates immediate user attention that may have arisen when an entity is in the Failed, BackOff, or Unhealthy state.
Normal: Indicates that requires less attention and resolves automatically.
Message summary to identify the cause of the event that occurred.