License Module- CCM
License Usage in the Cost Management platform shows how your licenses are used over time. You can view license usage by day or by month to compare allocated licenses against actual usage.
License Usage
To calculate license usage, we measure the runtime of virtual machines (VMs) across all supported cloud platforms. Each VM's usage is counted per day, and these daily figures are then summed up to provide the total monthly consumption
License Contribution Calculation
The license contribution of a machine is based on the duration it is active within a 24-hour period.
Full-day usage: If a machine runs continuously for 24 hours, it contributes 1 to the daily license count.
Partial-day usage: The contribution is calculated proportionally based on the number of minutes the machine was active.
Example 3. License Contribution Calculation - ExampleIf a machine runs for only 5 minutes in a day, the license contribution is calculated as:
License contribution = 5 / (60 × 24) = 0.00347222
Cloud Services Used for License Tracking
We calculate license counts based on the primary compute services from the following major cloud providers:
AWS: Elastic Compute Cloud (AmazonEC2)
Microsoft Azure: Virtual Machines
Google Cloud Platform (GCP): Compute Engine
Viewing License Usage
For MSP, dashboard view is:
In the MSP License View, you can see both parent and child license details. This view provides a complete picture of how licenses are distributed and used across organizational levels. Managed Service Providers (MSPs) can use this feature to monitor and manage license allocations across their client organizations.
Note
For MSP customers, the child organization must ensure that the designated user has Organization Admin permissions to view and manage these license details.
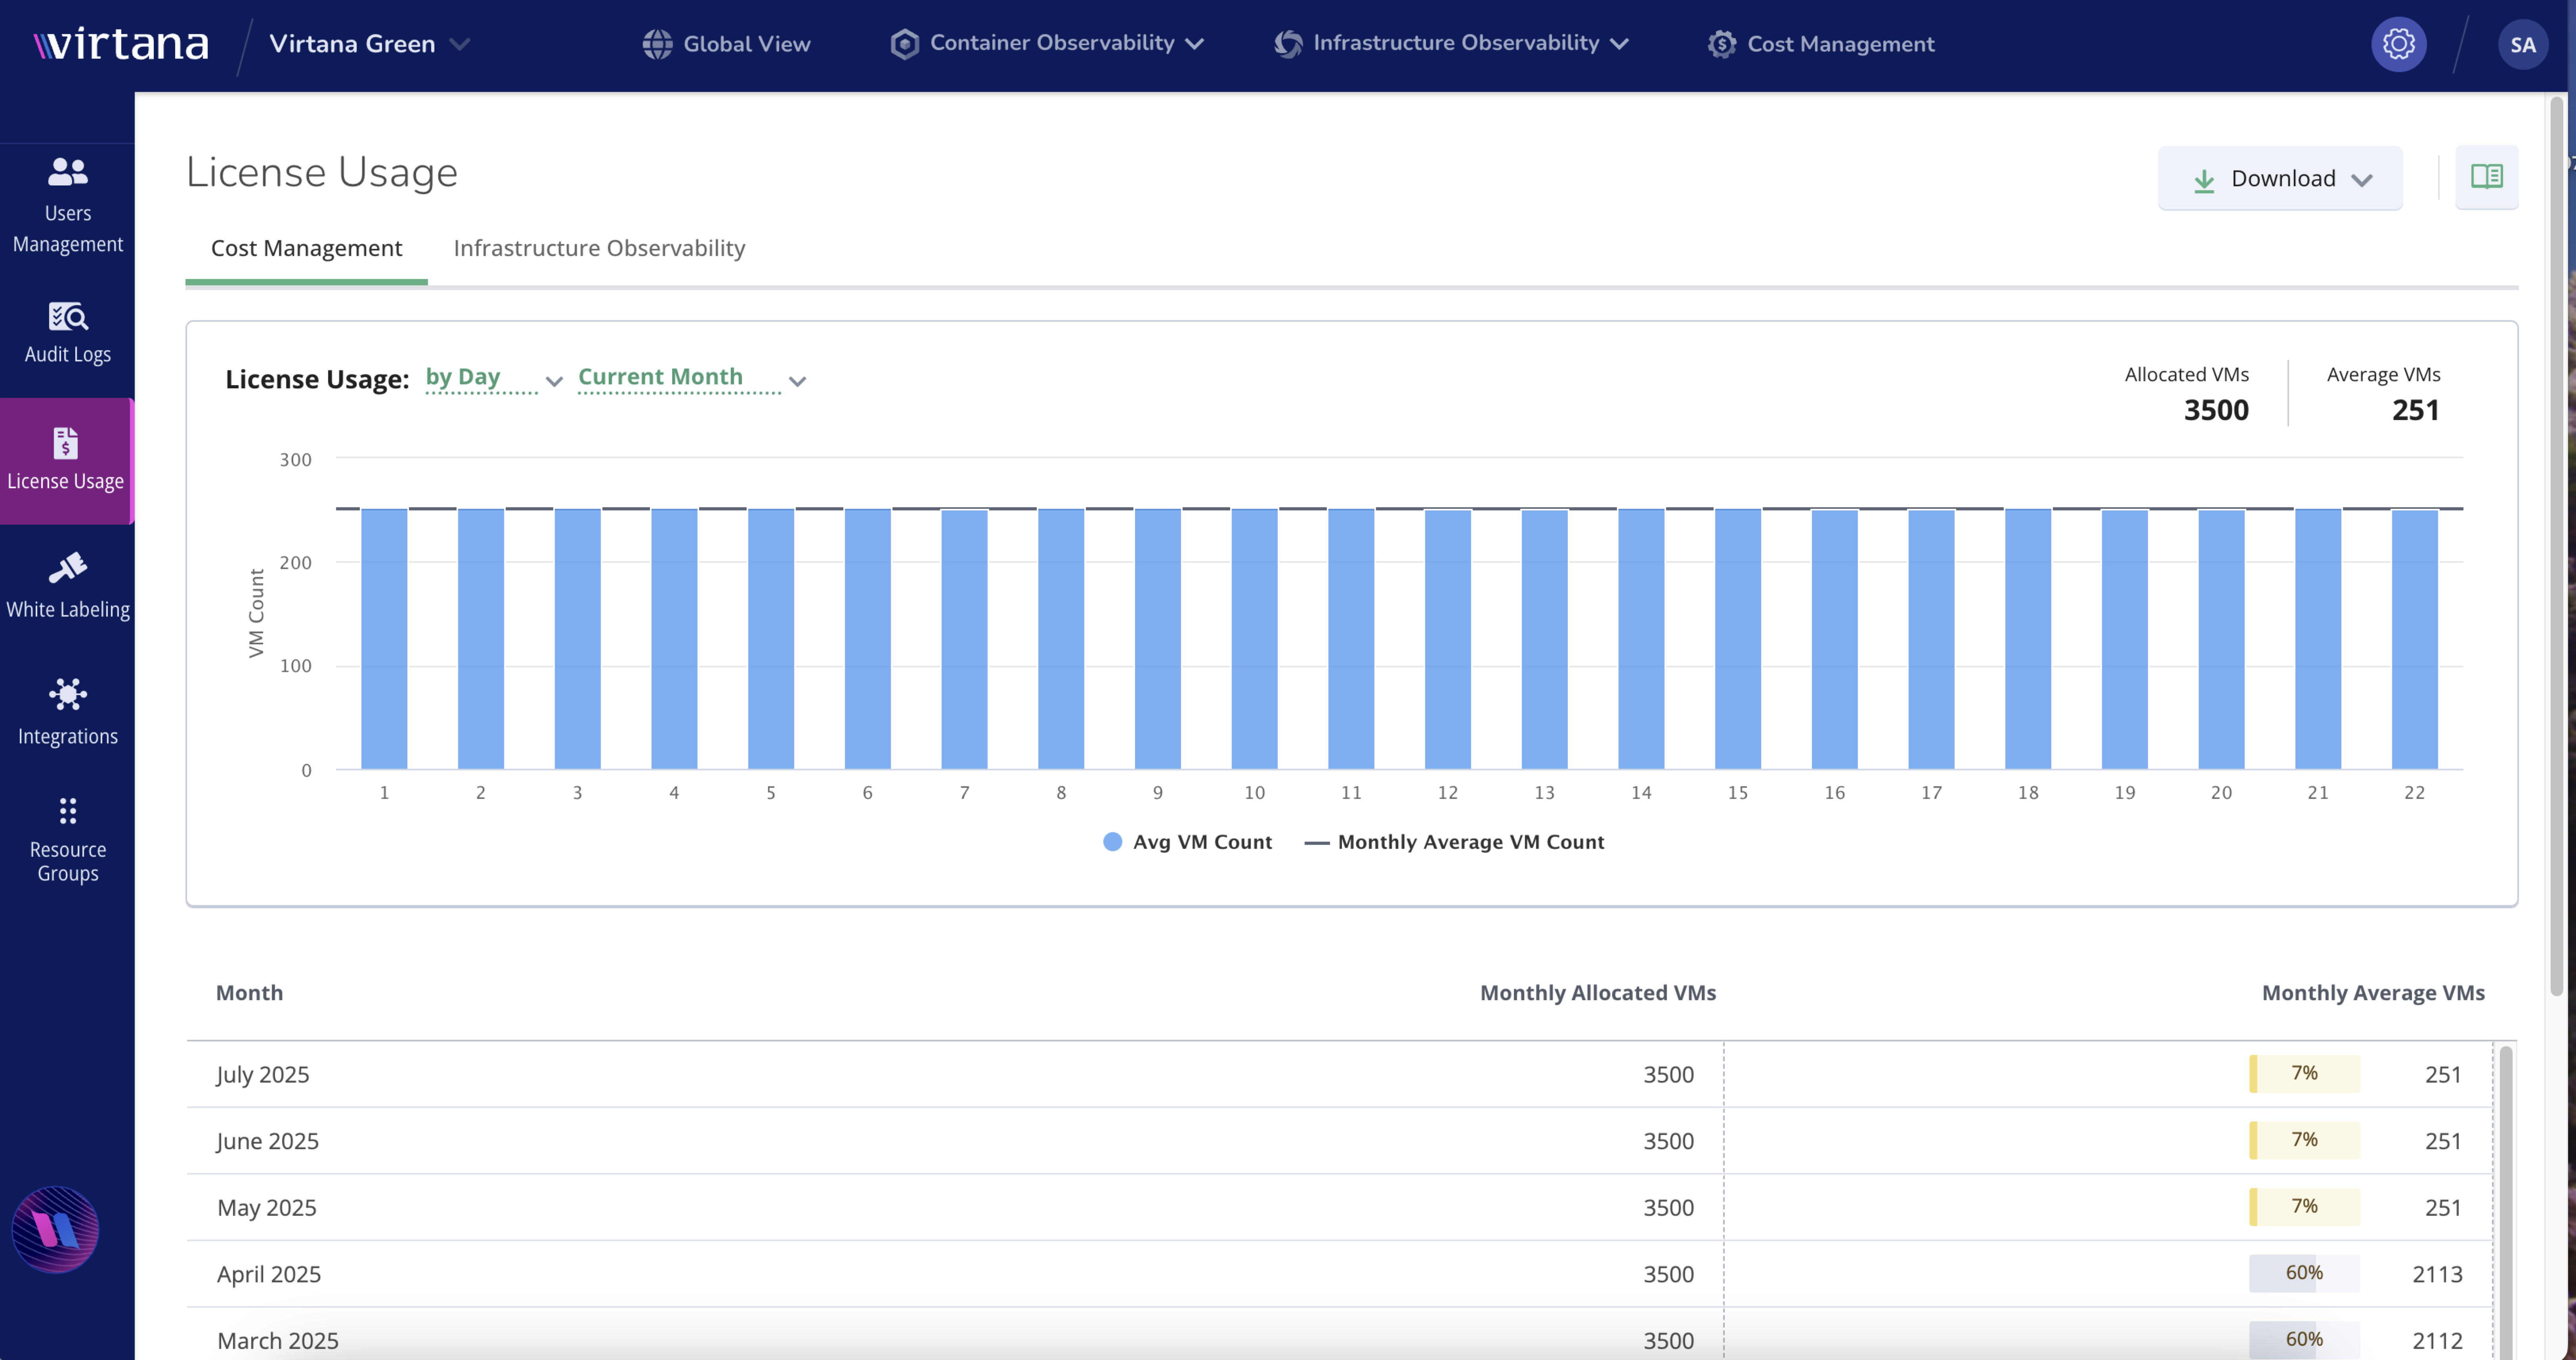
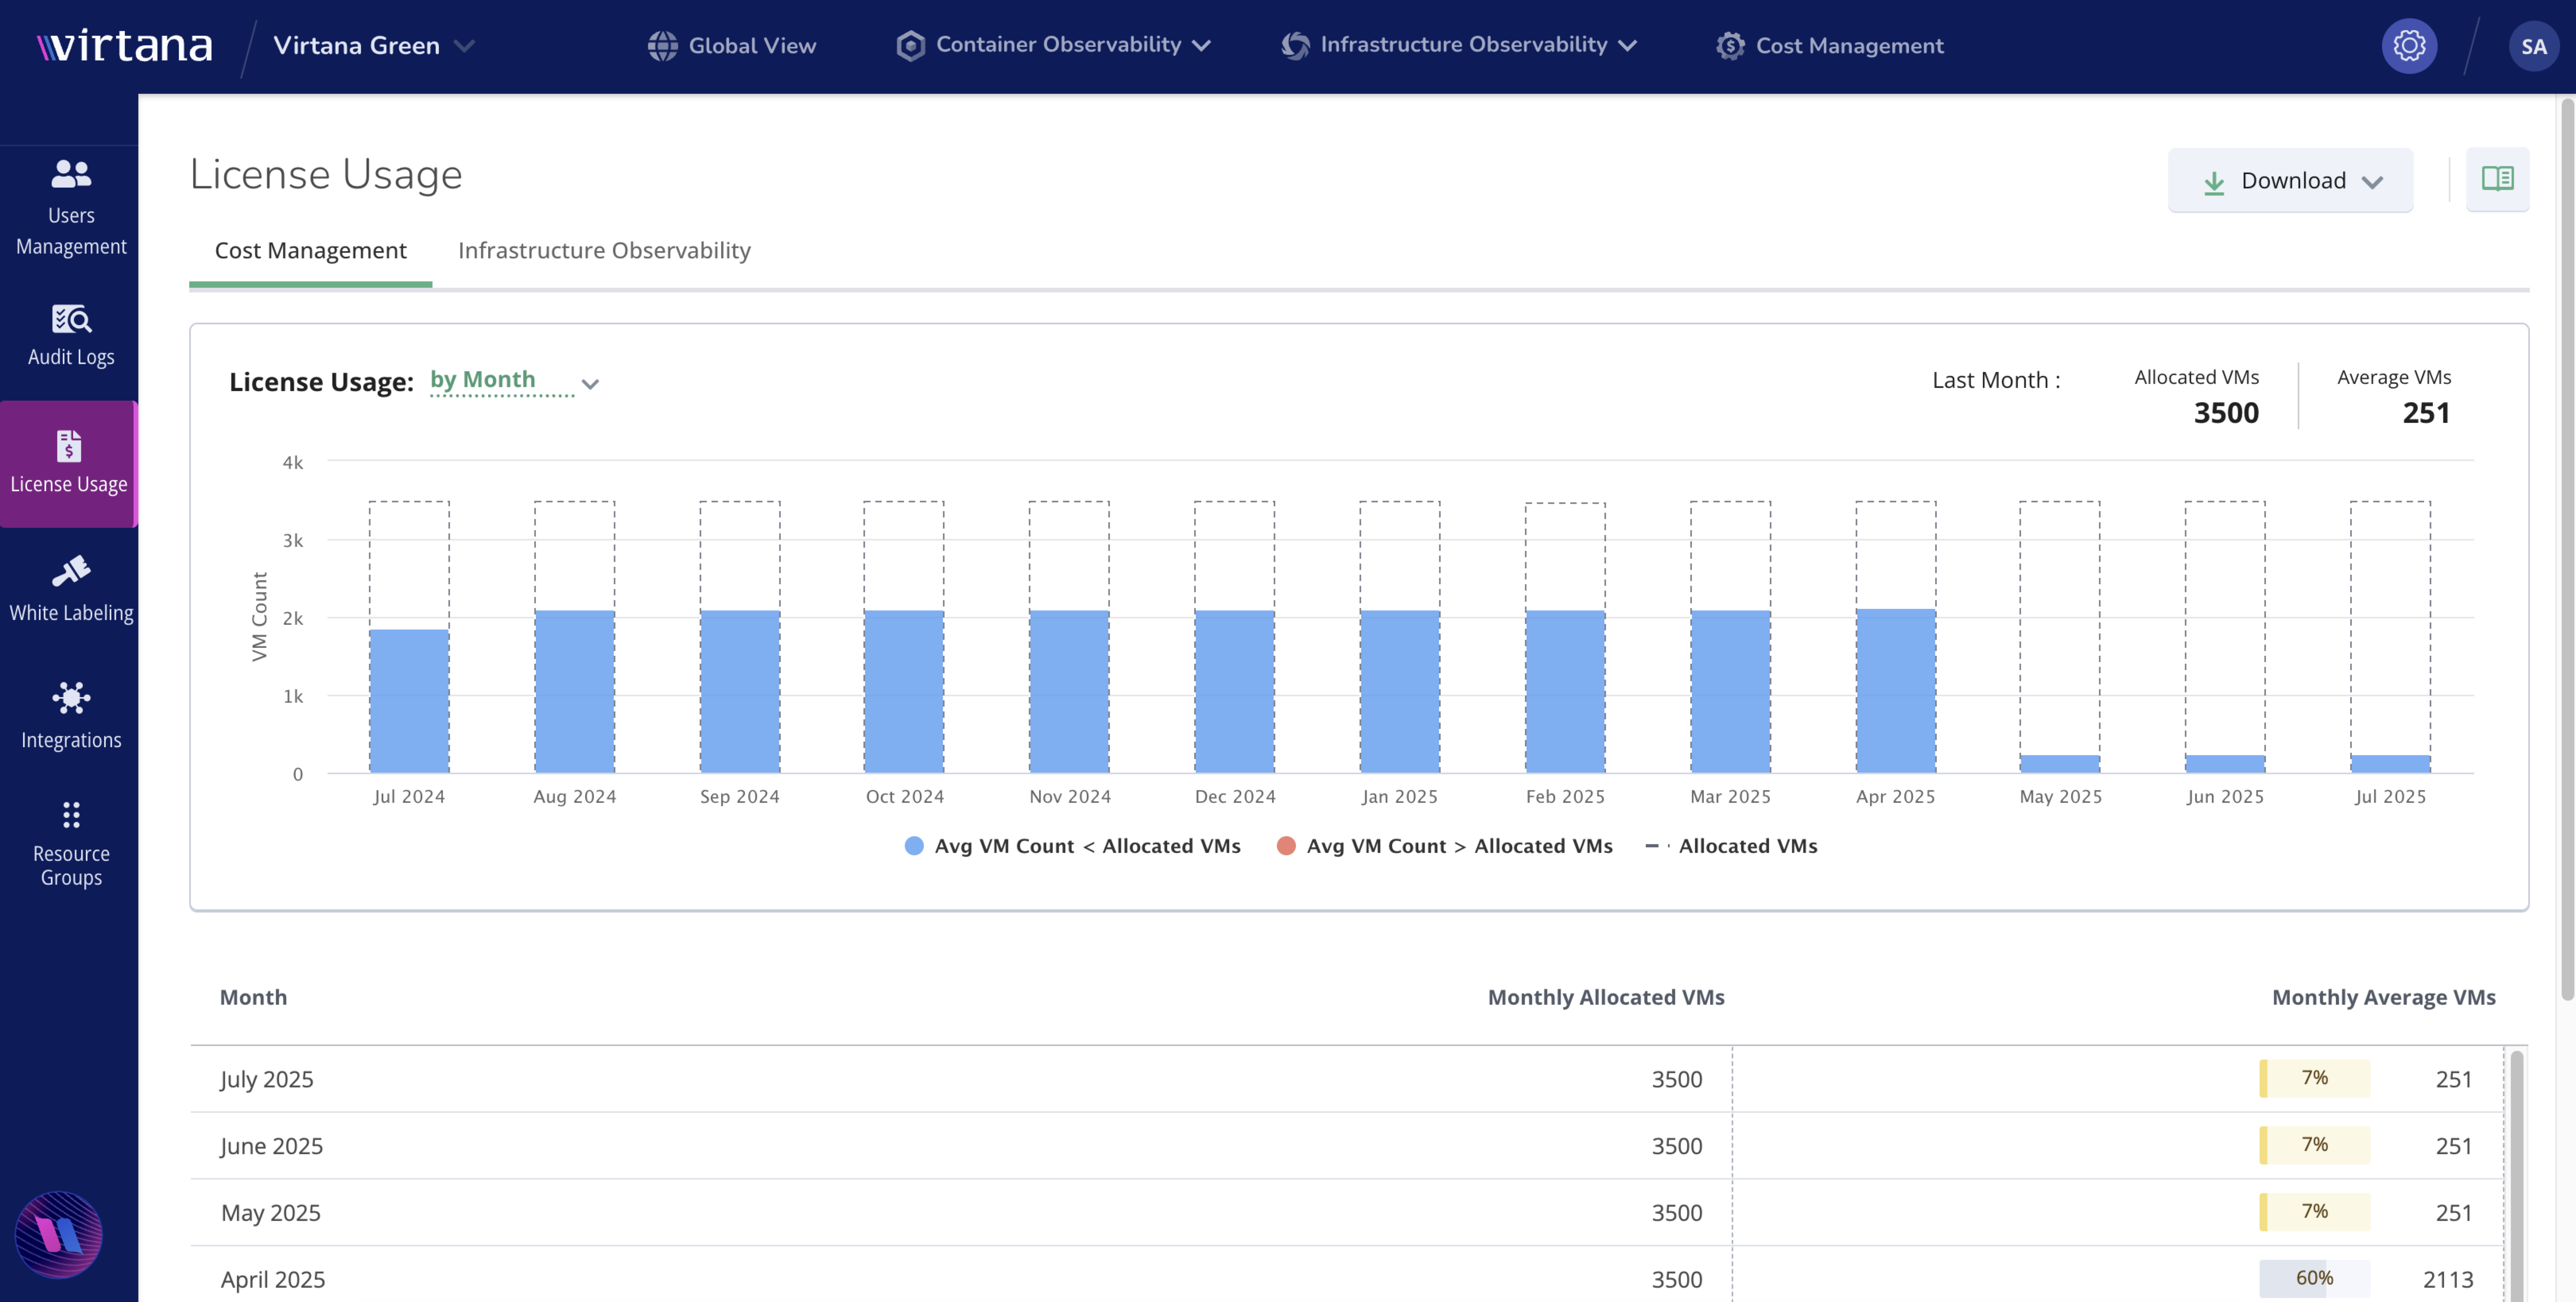
Daily and Monthly Views:
You can switch between viewing license usage on a daily or monthly basis, depending on your analysis needs.
Graphical Representation:
The license usage is displayed in a graph format for easy visualization:
Blue: Represents days or months where the average VM count is less than the allocated VMs.
Orange: Represents days or months where the average VM count exceeds the allocated VMs.
Gray: Represents the allocated average VMs.
Data Export:
You can download the license usage data as an XLSX document for further analysis or record-keeping.
Table Format View
Along with the graphical view, the same data can be viewed in a table format:
Month: Displays the specific month.
Allocated VMs: Shows the number of VMs allocated for that month.
Monthly Average VMs: Shows the average number of VMs used during that month.
This dual representation (graph and table) ensures you have both a visual overview and detailed data for effective license management.