Root cause analysis for alerts
The Virtana Platform presents root cause analysis (RCA) for an alert on the Troubleshooting tab of the alert page. The analysis depends on the alert and on how it is started. Some alerts carry a built-in analysis that runs as soon as the alert is raised, such as agentic RCA causing an AI agent automatically investigate IO alerts across every layer of your infrastructure (storage, SAN fabric, datastore, compute, network, and application), presenting the confirmed root cause, supporting metric evidence, and areas ruled out.
Agentic RCA for alerts
Agentic root cause analysis (RCA) runs an automated investigation for an alert and presents the findings on the Troubleshooting tab of the alert. Instead of manually checking the storage, fabric, datastore, and compute layers, Agentic RCA gathers evidence automatically and presents the findings as a written summary and a fishbone diagram.
When an IO alert fires, the first question is why: is it the storage array, the SAN fabric, the datastore, the host, or the application itself? Answering that manually means opening several dashboards, finding the related entities, and comparing their metrics over the same time window.
Agentic RCA does this for you. An AI agent takes the alert as its starting point, identifies which parts of the infrastructure could cause it, checks each against metric data from the IO appliance, and decides for each one whether it is the cause, a symptom of the cause, or not involved. The result appears on the Troubleshooting tab of the alert as:
A summary of the root cause, its impact, and how it happened.
A fishbone diagram that shows every area the agent checked and the result of each check.
The evidence behind each check: the metric, the entity, the measured values, the threshold, and a chart.
Recommended actions for the alert, on the Recommendation tab.
Because every check is shown, including the checks where nothing was wrong, you can see not only what the agent found but also what it ruled out.
Agentic RCA provides the following benefits:
Cross-layer: It correlates storage, fabric, datastore, compute, network, and application data for the same time window.
Explainable: Every conclusion links to the metric data it is based on. Gaps are stated, not hidden.
Fast: It runs in the background as soon as an alert that matches the policy criteria is raised, so the results are ready when you open the alert.
Actionable: It ends with ranked recommendations on the Recommendation tab, listed with the most important first and a pre-filled action that you can run from the alert.
Conversational: You can ask Copilot follow-up questions about the alert or about one specific check, for example, why a check was ruled out or what a metric means.
Alert investigation
An investigation runs in the following stages:
Stage | Action |
|---|---|
Scope | The agent reads the alert: the rule, the alerted metric and threshold, the entity, the IO instance, and the time of the breach. |
Plan | The agent identifies the related entities, for example, the application's VMs, ESX hosts and HBAs, datastores, switch ports, and storage array ports. It groups the possible causes into investigation areas. Each area becomes a branch of the fishbone diagram, and each possible cause in the area becomes a check. |
Collect evidence | For each check, the agent queries the IO appliance through the IO MCP endpoint for metric time series, inventory and properties, and topology relationships, over an analysis window around the time of the alert. |
Assess | The agent compares the measured values with thresholds and with the timing of the alert. It classifies each check as a Detected cause, a Symptom, or Checked, no issue found. When no data is returned, it marks the check as indeterminate and lists it as an investigation gap. |
Summarize | The agent writes the Copilot Generated Summary: the root cause, impact, mechanism, contributing factors, and investigation gaps. |
Recommend | The agent generates up to three recommended actions, based on the findings and on the actions configured for your organization. |
The number and names of the investigation areas and checks are chosen for each alert. For example, an alert on a GPU host shows different branches from an alert on the storage latency of an application.
Supported alerts and prerequisites
Agentic RCA is currently supported for IO alerts only. Before you use it, make sure that the following requirements are met:
The IO environment runs version
io-2026.9.1or later.Copilot is enabled. For more information, see Setting up the Virtana AI Copilot chatbot.
The IO MCP endpoint of the appliance that raised the alert is registered and reachable. The
IO_MCP_ENDPOINTandiomcpsecretsettings must be configured. After you change either setting, restart thevirtana-aiandalerts-servicepods. For more information, see Set up the IO MCP in Virtana Platform.The IO server presents a valid TLS certificate, or the
use_io_mcp_proxyfeature flag is enabled. For more information, see Enable growthbook feature flags.The access token validity is set to 1 hour because an investigation can run longer than the default token timeout. See Get Bearer Token.
Investigation methods
An investigation starts in one of two ways:
Method | Details |
|---|---|
Automatically, by policy | By default, an investigation starts for every new critical IO alert. Virtana Support can change the criteria: source instance, severity, priority, and entity type. The results appear on the Troubleshooting tab when the investigation completes. |
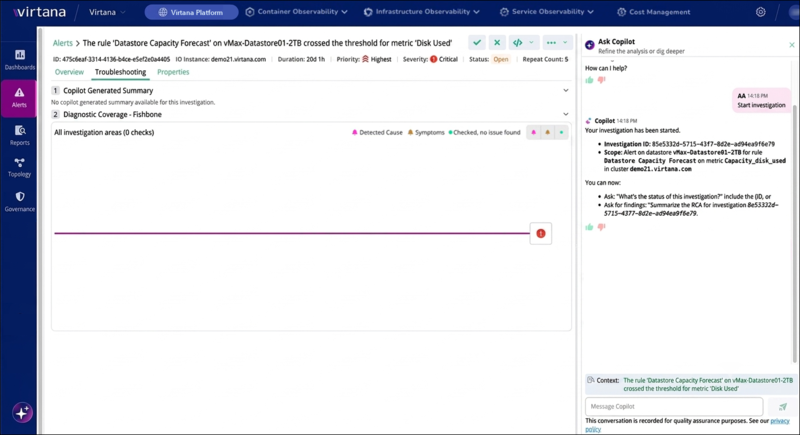
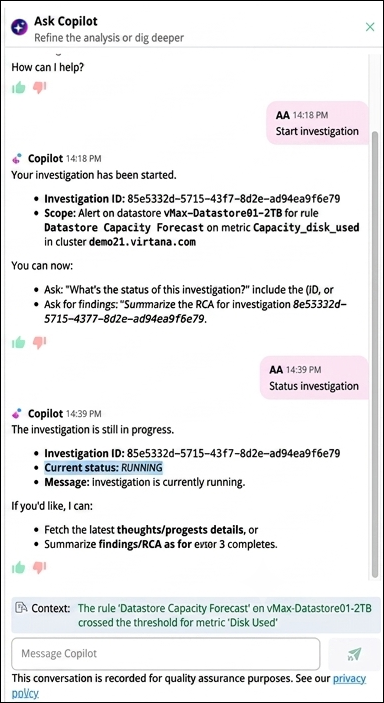
Manually, from Copilot | Open the alert, click the Troubleshooting tab, and enter |
While an investigation is running, the Troubleshooting tab shows that no summary is available yet.
 |
 |
The Troubleshooting tab
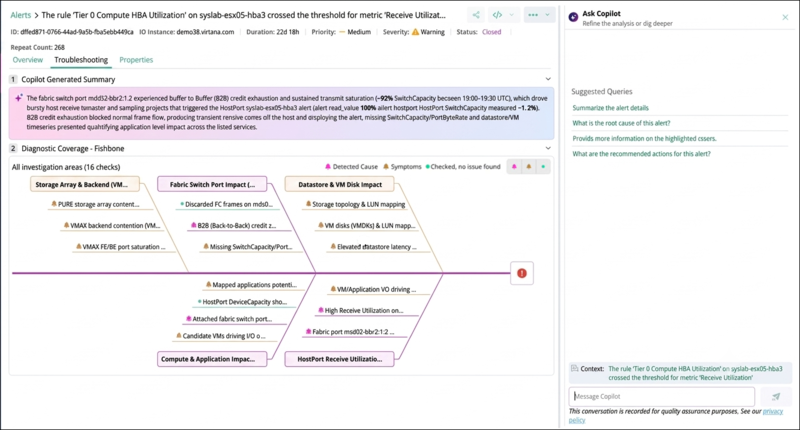
When an investigation completes, the Troubleshooting tab shows two numbered sections, Copilot Generated Summary and Diagnostic Coverage - Fishbone, and the Ask Copilot panel on the right. You can collapse each section with the arrow on its heading.
 |
Copilot Generated Summary
The summary explains the conclusion of the investigation in a few sentences, with the key measured values in bold. It normally has the following parts:
Part | Description | Example from a storage latency alert |
|---|---|---|
Root Cause | The component and behavior that most likely caused the alert, with the measured values. | VMAX front-end storage ports had write completion latency spikes up to 2.331 ms under heavy write workloads above 1,543 IOPS per port. |
Impact | How the root cause affected the alerted entity and metric. | The iSCSI write completion time rose to 115.46 ms, and the datastore write latency reached 66.128 ms, which breached the alert threshold. |
Mechanism | How the problem travelled from the root cause to the alert. | The heavy write workload on the front-end ports caused port-level delays and buffer-to-buffer credit starvation across the SAN fabric, which raised the datastore and iSCSI write response times. |
Contributing Factors | Other conditions that made the problem worse. | The SAN fabric interconnect ports had bandwidth surges up to 1,505.47 MB/s, with zero transmit credits 13.60% of the time. |
Investigation Gaps | Data that the investigation could not get, which limits the conclusion. None when all data was available. | Switch-port error and discard counters were unavailable for the window. |
For some alerts, the summary is a single paragraph instead of labeled parts. The paragraph covers the same points.
Diagnostic Coverage - Fishbone
The fishbone diagram shows every check that the investigation ran. The heading reports the total, for example All investigation areas (17 checks).
The head, on the right, represents the alert itself. It shows the alerted entity and the breached metric or rule that started the investigation. All branches feed into the head to show how the underlying conditions contributed to the alert.
Each branch is an investigation area, for example Storage Controller Saturation, SAN Fabric Congestion, Datastore Performance, Compute Host Workload, or iSCSI Flow Latency.
Each line on a branch is one check, for example Switch Port Link CRC Errors or ESX Host Memory Saturation. The diagram shortens long names. The full name appears at the top of the evidence panel when you click the check.
The color of each check shows its result. A branch takes the color of its most significant result.
Color | Result | Meaning |
|---|---|---|
Magenta | Detected cause | The investigation found an issue here that most likely caused the alert. |
Orange | Symptom | The investigation found an issue, but the issue is an effect of the root cause, not its origin. |
Green | Checked; no issue found | The investigation checked the area and ruled it out. |
Filter the fishbone diagram
In the top-right corner of the fishbone card, next to the legend, three toggle buttons let you show or hide checks by result:
Detected Cause (magenta bell): the checks that the investigation identified as primary root causes.
Symptoms (orange bell): the checks that the investigation identified as downstream symptoms.
Checked, no issue found (green circle): the checks that the investigation evaluated and confirmed as healthy.
All three buttons are enabled by default. You can turn each button on or off independently:
When you turn off a result, the diagram no longer shows the checks with that result.
When you turn off every result that an investigation area contains, the diagram hides the whole branch.
To hide healthy layers and focus on the detected causes and symptoms, turn off Checked, no issue found.
The count in the heading, for example All investigation areas (10 checks), always shows the total number of evaluated checks, regardless of the filters.
Typical investigation areas for IO alerts
The following areas and checks are examples from live investigations. The list is not fixed.
Area | Typical checks |
|---|---|
Storage arrays (front end, back end, controllers) | Front-end port write and read IOPS and completion time, front-end and back-end port percent busy, write pending, back-end utilization, and disk and director load |
SAN fabric and switch ports | Port throughput and capacity, buffer-to-buffer credit starvation (zero-credit time), CRC errors, Class 3 discards, and link resets |
Datastore | Read and write latency, outstanding I/O, and IOPS spikes |
ESX hosts and HBAs | CPU contention, memory saturation, VMkernel and storage stack delay, HBA queue depth, and HBA errors and link resets |
Transport (iSCSI and Ethernet path) | iSCSI flow latency, transport errors, host kernel processing delay, and switch port errors on the Ethernet path |
Application and VMs | Application response time (for example, STS read and write completion time), VM datastore latency, and virtual NIC errors |
GPU hosts | GPU and GPU memory utilization by process, NVLink throughput, and host send and receive byte rate |
Evidence panel for a check
Click any check in the fishbone diagram to open its evidence below the diagram. The diagram highlights the selected check, and the Copilot context changes to that check so you can ask about it directly.
The evidence shows one or more findings. Each finding has the following parts:
Part | Description |
|---|---|
Finding | A one-line statement of what the investigation observed, for example, "VMAX storage ports sustained elevated peak write rates of 1.54K IOPS during the latency peak". |
Context | The facts behind the finding: the entity or entities, the metric, the observed value or range and the peak time, the threshold used, the analysis window, the trend, and a verdict. |
Assessment | How the finding relates to the alert: Likely contributor, Possible contributor, not a contributor, or Indeterminate when there was not enough data. |
Chart | The metric data used: a bar chart of the observed peak, or a time-series chart with the threshold as a dashed line. |
When the IO appliance returns no data for a metric, the evidence says so, for example, No data returned. The check is assessed as Indeterminate, and the panel suggests what to verify, such as the metric collection or retention for that entity.
Ask Copilot about the investigation
The Ask Copilot panel uses the alert as its context. After you click a check, the panel uses that check as its context. The panel offers suggested queries that you can click instead of typing, such as Summarize the alert details, What is the root cause of this alert?, Provide more information on the highlighted issues, and What are the recommended actions for this alert?. You can also ask your own questions, for example, why a check was ruled out or what a metric means.
Review recommended actions
When an agentic RCA investigation completes, Virtana Platform also generates recommended actions for the alert. The recommendations are based on the findings of the investigation (the RCA summary and the detected causes in the fishbone diagram) and on the actions configured for your organization. They appear on the Recommendation tab of the alert.
To view the recommendations, open the alert and click the Recommendation tab. The number on the tab shows how many recommendations are available.
The tab changes with the state of the investigation:
State | What you see |
|---|---|
Recommendations available | The tab shows a count badge, and the recommendation cards are listed. |
Generating | The tab shows a loading indicator while the investigation is still running. |
No recommendations | The tab shows an empty-state message. The investigation completed but did not produce a recommendation. |
No investigation, or generation failed | The tab is not shown. |
Each alert gets up to three recommendations, listed in rank order, with the most important first. Each recommendation card shows the following information:
Field | Description |
|---|---|
Rank and title | The order of the recommendation and a short statement of what to do. |
Category and summary | The type of recommendation and a one-line summary. |
Explanation | Why the recommendation is made: which RCA finding (detected cause) it addresses and what it is expected to fix. The explanation can include paragraphs or code and command snippets. |
Tags | Urgency, ETA, risk, type, owner, and effort, to help you prioritize. |
Suggested action | The action to run, for example, Send to Slack or Create ServiceNow incident, shown on the Execute action button. |
On the recommendation card, click .
The execution form for that action opens, with the parameters pre-filled from the alert and the investigation, for example, the message text or the incident short description and description.
Review and complete the parameters.
You can change any value, or select a saved configuration as you do for any action.
Click .
The run is recorded against the alert like any manual action. It appears in the Executed Action card on the Overview tab and in the Executed Actions report.
Note
Virtana Platform suggests only actions that are configured for your organization: system notifications such as e-mail, Slack, and Teams; ServiceNow; and other configured action providers. It prefers the actions that your organization uses most often.
Recommendations never run an action automatically. You decide whether to run it.
This release does not suggest destructive or remediation actions, for example, StackStorm automation.
Saved action configurations, such as webhook URLs or tokens, are not shared with the AI model. Only the action definitions and how often your organization runs each action are used.
The button is not shown when the suggested action is not configured or cannot be run.
The Ask Copilot suggested query What are the recommended actions for this alert? remains available for follow-up questions. The Recommendation tab is the structured version that you can act on.
Example: walk through an investigation
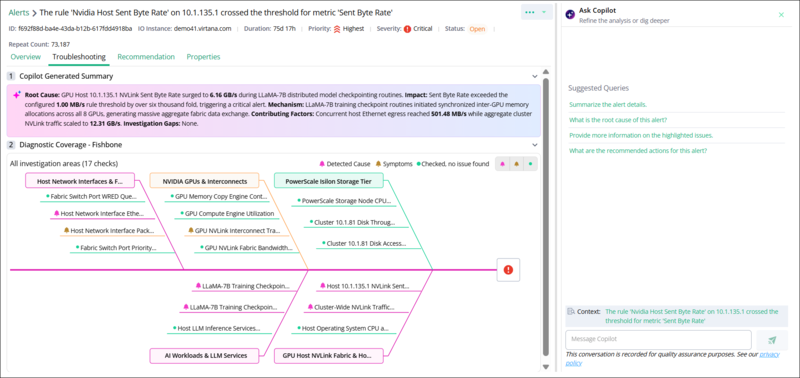 |
The Troubleshooting tab of the example alert shows the Copilot Generated Summary and the Diagnostic Coverage - Fishbone diagram with 17 checks in five investigation areas.
This example follows the alert in the above agentic RCA fishbone diagram: 'The rule 'Nvidia Host Sent Byte Rate' on 10.1.135.1 crossed the threshold for metric 'Sent Byte Rate''. The alert has Critical severity and Highest priority, and it comes from an IO appliance.
The fishbone diagram shows 17 checks in five areas: Host Network Interface & Fabric Switches, NVIDIA GPUs & Interconnects, PowerScale Isilon Storage Tier, AI Workloads & LLM services, and GPU Host NVLink Fabric & Host Engines.
Five checks are detected causes (magenta):
Host Network Interface Ethernet Egress Throughput in Host Network Interface & Fabric Switches.
LLaMA-7B Training Checkpoint Active GPU Compute Utilization and LLaMA-7B Training Checkpoint GPU Memory Allocation Surge in AI Workloads & LLM services.
Host 10.1.135.1 NVLink Sent Byte Rate Surge and Cluster-Wide NVLink Traffic Aggregation in GPU Host NVLink Fabric & Host Engines.
Two checks are symptoms (orange):
Host Network Interface Packet Drop Contention in Host Network Interface & Fabric Switches.
GPU NVLink Interconnect Transmission Volume in NVIDIA GPUs & Interconnects.
Ten checks are green, so the investigation ruled them out.
The Copilot Generated Summary ties the findings together. GPU host 10.1.135.1 experienced a significant spike in NVLink Sent Byte Rate, reaching 6.16 GB/s during LLaMA-7B distributed model checkpointing operations. This value exceeded the configured alert threshold of 1.00 MB/s by more than 6,000 times, resulting in a critical alert. During checkpoint synchronization, LLaMA-7B initiated coordinated inter-GPU memory allocation across all eight GPUs, causing substantial NVLink fabric traffic. As a result, host Ethernet outbound throughput peaked at 501.48 MB/s, while total cluster-wide NVLink traffic reached 12.31 GB/s.
To see the evidence for a check, click it in the diagram. The Ask Copilot panel then uses that check as its context, so you can ask, for example, Provide more information on the highlighted issues.
Act on an alert with agentic RCA
Perform the following steps to act on an alert with agentic RCA support:
In Global View, click Alerts and select the IO alert.
On the Overview tab, confirm the affected entity and the alerted metric.
Click the Troubleshooting tab and read the Copilot Generated Summary. Check Investigation Gaps.
In the fishbone diagram, turn off Checked, no issue found so that only Detected Cause and Symptoms remain. Click each detected cause and review its evidence and chart.
Turn Checked, no issue found back on and review the green checks to see what the investigation ruled out.
Ask Copilot follow-up questions about the alert or about a check.
Click the Recommendation tab and run the suggested action, or take your own action.
Close the alert when the issue is fixed.
Copilot prompts for investigations
You use the Ask Copilot panel to start an investigation and to track it. The following table lists the prompts:
Copilot prompt | What Copilot returns |
|---|---|
| Confirmation that an investigation has started for the alert you have open, with the Investigation ID and the scope of the investigation. |
| The current status of the investigation for the alert you have open, such as |
| The status of the specific investigation whose ID you supply, regardless of which alert you have open. |
| The findings of the named investigation, once it has completed. |
Policy-based RCA
Policy-based RCA automatically starts investigations for alerts that match predefined conditions. Defined policy sets the conditions that an alert must meet, for example, its source instance, severity, priority, or entity type. When a new alert matches those conditions, Global View starts an agentic RCA investigation for it in the background, and the summary and fishbone diagram appear on the alert's Troubleshooting tab when the investigation completes.
By default, agentic RCA is automatically generated for IO critical alerts only. If you want to override the default behavior and modify the triggering criteria (such as applying RCA to other alert severities or specific entity types), contact Virtana Support.
For the IO RCA feature to function, your IO environment must be running IO version io-2026.9.1 . And The IO_MCP_ENDPOINT configuration must be properly configured and reachable.
Policy creation and customization are managed by Virtana Support and are not directly configurable in the UI.
Troubleshooting and limitations
Situation | Recommended action |
|---|---|
The Troubleshooting tab shows no summary yet. | The investigation is still running, or no investigation has been started. Enter |
The investigation does not start. | Check the prerequisites: the IO MCP endpoint is registered and reachable, the TLS certificate is valid, the proxy flag is enabled, and Copilot is enabled. |
The session expires during an investigation. | Set the access token validity to 1 hour. See Get Bearer Token. |
Investigation Gaps lists missing data, or checks are Indeterminate. | The IO appliance had no data for those metrics in the analysis window. Check the collection and retention settings for those entities. The conclusion is based on the data that was available. |
The alert is not an IO alert. | Agentic RCA is available for IO alerts only. CO tracepath alerts have their own RCA. For more information, see Tracepath RCA alerts. |
Tracepath RCA alerts
A tracepath RCA alert tells you that a traced transaction path in your environment has breached its response-time service-level objective (SLO), and it identifies the underlying cause automatically. Virtana CO detects the breach at the trace path level, runs a multi-layer root cause analysis, and surfaces the result in the Virtana Platform Alerts list, so you can triage the slowdown without switching between separate application, Kubernetes, and infrastructure dashboards. See traces for detailed tracepath information.
A tracepath RCA alert differs from a threshold or single-metric alert because it correlates data across application traces, Kubernetes infrastructure, pod and node metrics, logs, and events, and then presents the findings in one consolidated view. The alert connects what you see in the app to what is happening in the underlying infrastructure, so you can tell whether the slowdown comes from application code, a noisy neighbor on the same node, resource pressure on a pod or node, or an external dependency.
About tracepath
A tracepath is Virtana's representation of a repeated transaction flow through your services. Understanding how Virtana builds a tracepath helps you interpret a tracepath RCA alert, because the alert is raised against the tracepath rather than against a single request.
Your application exposes traces as a request moves between services. A trace collector gathers the individual spans from every service involved in the request and uses a shared trace token to assemble them into one complete trace, which represents a single transaction. When the same request runs again, it creates a new transaction that follows the same sequence of services. Virtana groups these repeated transactions into a tracepath, the reusable representation of that flow. A tracepath is made up of trace services (each service the request passes through, such as web-server or db-service), and each trace service contains one or more trace operations (the endpoints or internal calls it runs, such as POST /api/traffic-6).
A standard tracepath alert notifies you when a trace path breaches its response-time SLO. Virtana CO computes the SLO threshold dynamically from the tracepath's past observations, so the alert fires when the current response time is significantly higher than the historical baseline. A tracepath RCA alert is this same SLO-breach alert with an automated root cause analysis attached. The tracepath is slow, and it identifies which trace service, operation, pod, node, log condition, or external dependency is responsible.
Identify a tracepath RCA alert in the Alerts list
Tracepath RCA alerts appear in the Virtana Platform Alerts list alongside your other alerts. Because these alerts originate in Virtana CO, they show a source type of CO and an entity type of tracepath. To find them, filter the list by the tracePath entity type.
Each tracepath RCA alert uses a description in the following form, where the entity name is the name of the tracepath that breached its SLO:
SLO: TracePath <cluster>@<namespace>^<service>#<method> <path>: Response time SLO breach detected based on past observations.
Virtana derives the tracepath name from the root span of the path, which is the first service and operation that the transaction passes through. The cluster, namespace, service, method, and route operation in the name therefore identify where the traced transaction enters your environment, not the service that caused the slowdown. To find the service and operation responsible for the breach, use the root cause analysis on the Troubleshooting tab.
For example, the following description identifies an SLO breach on the tracepath that starts at the web-server service with the POST /api/test-1-k8sissue route operation in the co-dev-02 cluster:
SLO: TracePath co-dev-02@test1^web-server#POST /api/test-1-k8sissue: Response time SLO breach detected based on past observations.
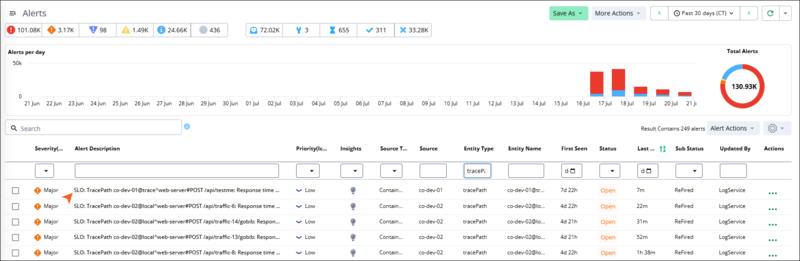 |
The Alerts list is filtered by the tracepath entity type, showing several tracepath SLO-breach alerts with their severity, priority, source, entity name, status, and sub-status.
Investigate a tracepath RCA alert
When you select a tracepath RCA alert in the alerts list, the alert detail page opens. The page contains three tabs: Overview, Troubleshooting, and Properties. Together, they provide a summary of the issue, root cause analysis, and alert metadata.
Overview tab
The overview tab summarizes the slowdown and the affected tracepath. The top of the tab presents a set of panels, and the lower half provides metric and topology sub-tabs for the same tracepath.
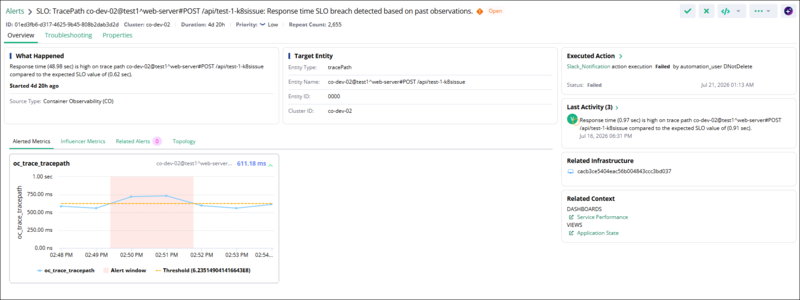 |
The Overview tab shows the What Happened, Target Entity, Executed Action, Last Activity, Related Infrastructure, and Related Context panels, with an Alerted Metrics chart plotting tracepath latency against the threshold during the alert window.
The panels at the top of the overview tab describe what happened and which entity is affected.
Panel | Description |
|---|---|
What Happened | The detected anomaly, stated as the measured response time compared with the expected SLO value, how long ago the breach started, and the source type (Container Observability). |
Target Entity | The affected trace path: the entity type ( |
Executed Action | Any automated action triggered by the alert, such as a Slack notification, with the action's execution status, the automation user that ran it, and the timestamp. |
Last Activity | The most recent activity entries for the alert, such as later SLO-breach occurrences, each with the measured and expected response times and a timestamp. |
Related Infrastructure | The infrastructure entity associated with the affected trace path, such as the pod that backs the terminal service. |
Related Context | Quick links for further investigation, including the Service Performance dashboard and the Application State view. |
Below the panels, the Overview tab provides four sub-tabs for the alerted tracepath.
Sub-tab | Description |
|---|---|
Alerted Metrics | The tracepath latency metric ( |
Influencer Metrics | Related metrics that influenced the breach, to help you correlate the latency with other measurements. |
Related Alerts | Other alerts related to the same trace path, with a count shown on the sub-tab. |
Topology | The service-to-service flow of the tracepath, from the entry service to the terminal service, so you can see the path the request follows. |
Troubleshooting tab
The troubleshooting tab presents the root cause analysis for the alert. It has two parts: a Root Cause Analysis Summary and an interactive Root Cause Analysis diagram.
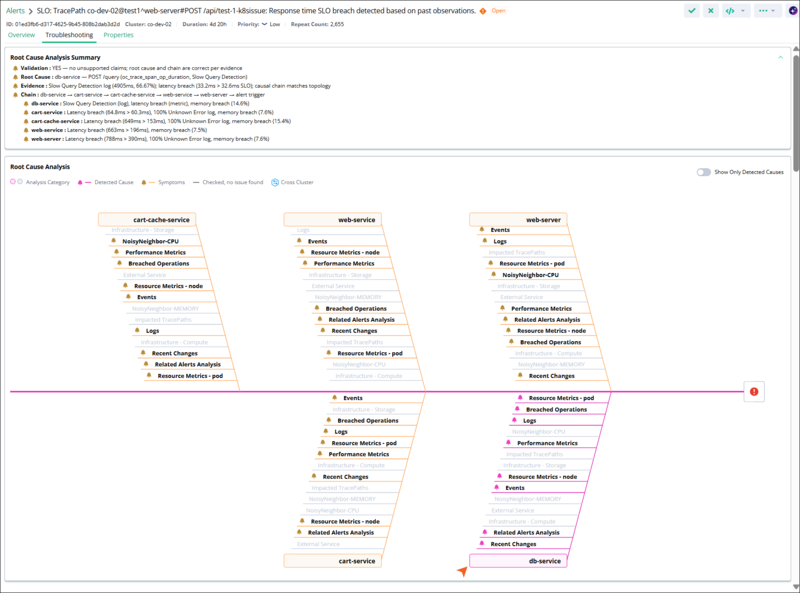 |
The Troubleshooting tab shows the Root Cause Analysis Summary with validation, root cause, evidence, and chain, and a fishbone diagram in which the terminal service is marked as the detected cause and the other services are marked as symptoms.
The Root Cause Analysis Summary describes the most likely cause in a few lines. Virtana CO builds the summary from the evidence that the analysis collects and presents it in the following parts.
Validation: Whether the analysis supports the stated root cause and chain, based on the collected evidence.
Root Cause: The service and operation identified as the origin of the slowdown, with the metric and log condition that point to it, for example, a slow query detected on
db-serviceforPOST /query.Evidence: The supporting signals, such as a log detection with its frequency, the latency breach against the SLO, and confirmation that the causal chain matches the trace path topology.
Chain: The causal chain from the originating service through the calling services to the alert trigger, with the breaches detected at each service.
The Root Cause Analysis diagram shows every trace service in the breaching path as a fishbone, with the analysis categories that CO evaluated for each service. The diagram uses color to distinguish the categories that identified an issue from those that did not.
A Detected Cause (pink) is a category where CO found the issue that most likely caused the slowdown.
A Symptom (orange) is a category that shows an effect of the root cause rather than its origin.
Checked, no issue found (gray) is a category that CO evaluated but where it found no issue.
Enable the Show Only Detected Causes to hide the categories that found no issue and focus on the detected causes and symptoms. A Cross Cluster indicator marks a contributing service that runs in a different cluster.
The diagram usually marks more than one service as breaching, and marks the terminal service as the detected cause. This happens because each service operation's measured duration includes the time spent in the operations it calls. Latency introduced by the terminal service is therefore counted in every service that calls it along the path, so those services also show a latency breach. CO identifies the terminal service in the breach chain, the deepest service where the latency originates, as the detected cause, and classifies the other breaching services as symptoms.
For each service, CO reports the following analysis categories.
Root Cause Analysis category | What CO evaluates |
|---|---|
Breached Operations | The traced operations in the service that exceeded their latency threshold, with the operation one level before and one level after in the path for context. |
Performance Metrics | The RED metrics (request rate, error rate, and duration) for the service and its operations during the alert window. |
Resource Metrics - pod | CPU, memory, and disk utilization for the pods that back the service. |
Resource Metrics - node | CPU, memory, and disk metrics for the nodes that host the pods, to reveal infrastructure pressure. |
Logs | Error indicators in the logs of the pods that back the service, such as slow query detections, timeouts, unknown errors, and connection failures. |
Events | Kubernetes events for the affected pods and nodes, such as scaling actions and node conditions. |
Recent Changes | Recent image or configuration changes that correlate with the start of the slowdown. |
Related Alerts Analysis | Existing service- or operation-level alerts that are linked to the tracepath. |
NoisyNeighbor-CPU and NoisyNeighbor-MEMORY | Whether a co-hosted pod or process on the same node consumed excessive CPU or memory and starved the service's pod of resources. |
Infrastructure - Compute and Infrastructure - Storage | Compute or storage pressure on the underlying infrastructure. |
External Service | Whether a downstream or external dependency, such as a database endpoint or third-party API, is slow or generates an error. |
Impacted TracePaths | Other tracepaths affected by the same deviating service operation, to help you assess the broader impact. |
Analyze an impacted service
To investigate the evidence behind a detected cause or symptom, select a service in the root cause analysis fishbone diagram. The troubleshooting tab drills into that service and shows a detailed dashboard for it. A breadcrumb at the top of the tab shows which service you are viewing.
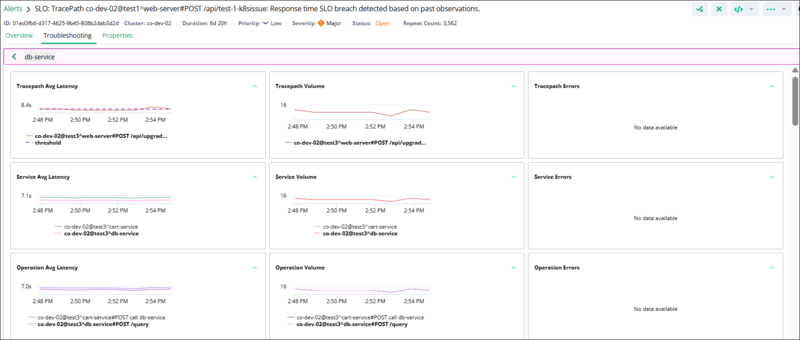 |
The drill-down dashboard for a specific service, showing tracepath, service, and operation latency, volume, and error charts; latency-versus-node and latency-versus-pod resource charts; an events correlation timeline; a recent changes timeline; a logs table; related alerts; and the trace and vertical topology.
The dashboard groups the metrics for the selected service into the following panels, ordered from the application layer down to the supporting infrastructure and topology.
Panel | Description |
|---|---|
Tracepath Avg Latency | The average response time of the affected tracepath over the alert window, plotted against the SLO threshold. |
Tracepath Volume | The number of requests on the tracepath over the same window. |
Tracepath Errors | The count of error requests on the tracepath. The panel shows No data available when there are no errors. |
Service Volume | The request volume handled by each trace service. |
Operation Avg Latency | The average latency of each trace operation, such as the selected service's |
Operation Volume | The request volume for each trace operation. |
Tracepath Avg Latency vs Node CPU Usage | The tracepath latency overlaid on the CPU utilization of the node that hosts the service's pod, to reveal CPU pressure that tracks the slowdown. |
Tracepath Avg Latency vs Node Memory Usage | The tracepath latency overlaid on the node's memory utilization. |
Tracepath Avg Latency vs Pod CPU Usage | The tracepath latency overlaid on the CPU utilization of the pod that backs the service. |
Tracepath Avg Latency vs Pod Memory Usage | The tracepath latency overlaid on the pod's memory utilization. |
Events Correlation Timeline | Kubernetes events across the Deployment, Node, Pod, and Container layers on a shared timeline, color-coded as a warning (pressure or failure) or normal, so you can spot events such as node scaling or a certificate expiration warning that line up with the slowdown. |
Recent Changes Timeline | Deployment, image, or configuration changes for the services over time, so you can correlate a change with the onset of the latency increase. |
Logs with Errors and Exceptions | Log entries from the service's pods that contain errors or exceptions, with the timestamp, error type, matched keywords, percentage of occurrences, and the message text. |
Related Alerts | Other alerts related to the selected service or its infrastructure, with the relation (such as child), repeat count, source, entity type and name, and when each was first and last seen. |
Trace Topology | The tracepath drawn as a left-to-right service flow, with the average latency, request count, and error count for each hop, so you can see where latency and errors accumulate. |
Vertical Topology | The infrastructure stack that backs the selected service, the hosts or virtual machines, and the node, so you can trace the service down to the infrastructure it runs on. |
Properties tab
The properties tab shows the full alert metadata, which is useful when you correlate the alert with other systems or verify how it was generated.
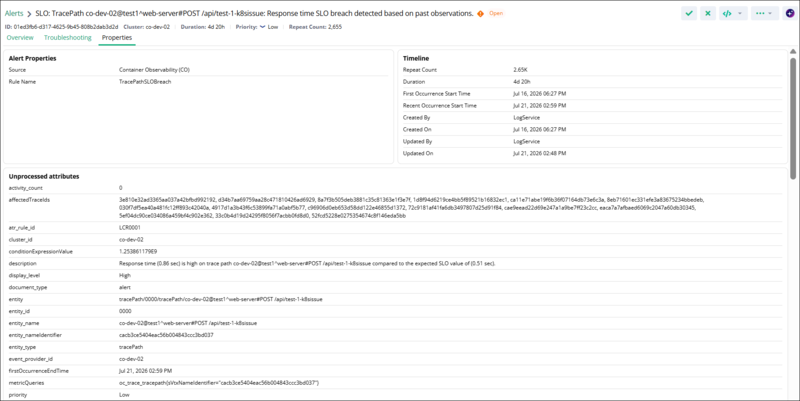 |
The properties tab shows alert properties, a timeline with occurrence times and repeat count, and the unprocessed attributes for the tracepath alert.
The tab groups the metadata into alert properties, a timeline, and the raw alert attributes. The following properties are the most useful for identifying and classifying a tracepath RCA alert.
Property | Meaning |
|---|---|
Source | The originating product, Container Observability. |
Rule Name | The rule that raised the alert, |
problemCategory and problemSubCategory | The classification of the problem, |
entity_type | The alerted entity type, |
metricQueries | The query for the alerted metric, based on |
thresholdValue | The dynamically computed SLO threshold that the response time breached. |
Repeat Count and Duration | How many times the breach recurred and how long the alert has been open. |
affectedTraceIds | The IDs of the individual slow traces that contributed to the alert. |
Act on a tracepath RCA alert
Use the following workflow to move from a tracepath RCA alert to a corrective action.
In the Virtana Platform Alerts list, filter by the
tracePathentity type to find tracepath RCA alerts, and select the alert you want to investigate.On the Overview tab, review the What Happened and Target Entity panels to confirm which tracepath is affected and how far its response time exceeded the SLO.
Open the Alerted Metrics sub-tab to see when latency breached the threshold, and open the Topology sub-tab to see the service-to-service flow of the tracepath.
On the Troubleshooting tab, read the Root Cause Analysis Summary to see the identified root cause and the supporting evidence.
In the Root Cause Analysis diagram, turn on Show Only Detected Causes and review the detected cause on the terminal service, then review the analysis categories, such as Logs, Events, and Recent Changes, that support it.
Use the Related Context links to pivot to the Service Performance dashboard, the Application State view, and the relevant logs for further investigation.
Take a corrective action based on the root cause category, such as scaling a deployment, adjusting resource limits, rolling back a recent image change, or addressing an external dependency.
Note
Tracepath RCA alerts are generated at the tracepath level. An individual slow transaction does not create its own alert. Instead, each matching slow trace contributes to the repeat count and activity of the parent tracepath RCA alert, and its trace ID appears in the alert's affected trace IDs.